Pages

Tuesday, March 19, 2013

The Mystery of Bleach, Brand Loyalty, and The Latino Story

Spring is here and cleaning is in the minds of many. For years I have heard that bleach is an important cleansing agent in Hispanic households.  When visiting Latino households I regularly smell bleach in the kitchens and bathrooms.  

Using data from Experian Marketing Services’ Simmons National Hispanic Consumer Study that was collected in the twelve months ending on November 20, 2012, I found that 87% of Hispanic adults live in households that use bleach while only 82% of non-Hispanic adults live in households that use bleach. That represents an index of 105 for Latinos compared with an index of 99 for non-Latinos.

Interestingly, then, the attitudes expressed by Hispanics during my many years of doing research seem to be reflected in quantitative data. Bleach is an important part of the cleaning and disinfecting routine of Hispanics, and to a larger extent than anyone else.

Also, we all have heard about how brand loyal Latinos are. Because of a weak economy and other factors I suspected that private label and less expensive products would be most popular at this time. To my surprise Clorox is the brand of bleach most likely to be used by Latinos, even though it is a more premium brand. The following chart reports the brands used “most often” in Hispanic and non-Hispanic households.


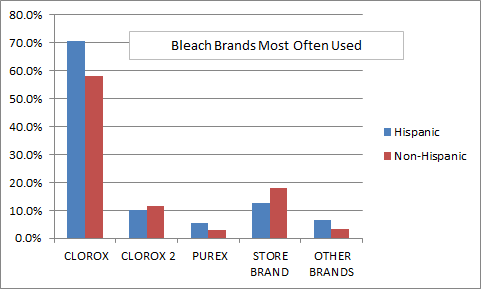
Clearly, brand loyalty is alive and well among Latinos.  How else would one explain that Clorox bleach is their preferred brand? When doing qualitative research with Hispanics I frequently hear comments regarding the importance of staying with brands that have shown their efficacy over time.  In particular, Hispanics seem to be more brand loyal when it comes to products that are more central to the wellbeing of their families. This is good news for the Clorox company and an interesting challenge to alternative bleach manufacturers. This is a category where there is ample opportunity to grow among Hispanics.

Clorox 2 is a different type of product as it is not an oxidant, instead of bleach it uses oxygen as a cleaning agent. Interestingly, this product does not do as well among Hispanics, at least not yet.

At any rate, the story told here serves as a brand loyalty case study and a reminder of the value of cleanliness that Latinos hold dear. This also serves as a reminder that cultural values for product usage can be very powerful in determining consumer behavior.

The data used here is from Experian Marketing Services’ Simmons National Hispanic Consumer Study and was collected from October 24, 2011 to November, 2012. The sample of Hispanics contains 8,521 individuals and the non-Hispanic sample has 17,043 people.


Tuesday, February 26, 2013

Children’s Influence in the Multicultural Marketplace

For many years I have conducted qualitative research with Latino women and have generally found that they are very willing to yield to their children’s requests for purchases, even if these are non-essential.  I have had the suspicion that this is particularly true of Hispanic women in comparison to other mothers but have not had the quantitative data to explore this idea.

Using data from Experian Marketing Services’ Simmons National Hispanic Consumer Study that was collected in the twelve months ending on August 31, 2012, I created crosstabulations with self identification as Hispanic/Latino, Asian, African American/Black, or White by those who agreed a lot or a little (combined) with the statement “I find it hard to resist my children’s requests for non-essential purchases” and “I enjoy shopping with my children.” The results for both have striking similarities, not surprisingly, perhaps, as seen in the charts below:

I Find it Hard to Resist My Children’s Requests for non-Essential Purchases


I Enjoy Shopping with My Children

Hispanics are quite a bit more likely to enjoy shopping with their kids and also to yield to their requests.  They are followed by Asians who show a similar pattern when it comes to enjoying the shopping experience with their kids, but not so in yielding to their requests for non-essential purchases.  Perhaps the Asian approach to child rearing, which is known to be stricter, accounts for their lack of yielding.  Non-Hispanic Whites and African Americans are less likely than Latinos to enjoy the shopping experience with kids and yielding to their children.

The meaning of these findings is likely to relate to the way in which these consumers interpret their relationship with their children.  In particular, I have heard Hispanics many times articulate the notion that they want their kids to have what they did not have as children.  They have also indicated they feel guilty for not doing the absolute best they can for their kids.

Hispanics are at a stage in their immigration and economic development where pleasing their children and families in general is a luxury they could not afford before. What they do in life is for their children and want them to be happy as they grow up.  They seem to place a very strong value in their sense of fulfillment. Perhaps Whites have become habituated to living in a culture of abundance where kids can wait to fulfill their desires and where shopping represents labor rather than fun.

This data shows that it is not just a stereotype but an actual trend that Latinos shop in family groups and have fun doing so.  Asians show a more complex pattern in which they enjoy the shopping experience with kids, but are strictest in pleasing kids as compared with anyone else.  The implications for marketers are that Latino children in particular can be important influences in the decision making regarding purchases of products and that they cannot be ignored in the overall communication and placement plan.

As we have discovered in other pieces of research, collective decision making is more prevalent among Latinos than among other groups. Thus, the different parts of the decision making process need to be taken into consideration.

The data used here is from Experian Marketing Services’ Simmons National Hispanic Consumer Study and was collected from August 1, 2011 to August 31, 2012. The sample of respondents with children at home contained 2,955 Latinos/Hispanics, 3,645 non-Hispanic Whites, 552 non-Hispanic African American/Black, and 253 non-Hispanic Asians.

Wednesday, January 30, 2013

How Should Brands Give Back in a Multicultural Market?

Marketers frequently ask how their brands can give back to a community to create good will and enhance their brand's position. The answer to the question is complex, but one of the ways of trying to address it is by asking consumers of different cultural and acculturation backgrounds how they rate different actions that brands can take in order to give back.

In 2012 with the cooperation of Research Now and the leadership of +Melanie Courtright, we again collected an online national sample composed of Hispanics and Asians born in the US and those born abroad, in addition to African Americans and Non-Hispanic Whites. We used the country of birth as a proxy for acculturation to see if technology adoption varied accordingly.

We asked respondents to rate different actions that companies can take to give back as follows:
“When a brand gives back to a community, which of the following are most and least important contributions from your perspective? Please rank in order, from 1, most important, to 5, least important, each of the following items.”

The following chart shows the total across all respondents (indicated by the blue bars) and for each of the culturally unique groups (indicated by the colored lines) for the rank of “Most Important” in regard to the following possible brand actions:

  • Provide jobs
  • Give scholarships
  • Help clean the environment
  • Keep jobs in the local community, and
  • Employees get free time to do community service


The rank shown is just the “Most Important” for each of the items. The totals for each culturally unique or acculturation group add to slightly more than 100% because each item was rated independently.

The first surprise is that the differences across culturally unique and acculturation groups is relatively small and that these cultural groups agree on the priority of the items.  The number one priority across the board is that the most important contribution that brands can make is to provide jobs to the community, followed by keeping jobs in the local community. It is perhaps not surprising that these two items have the highest priority given the economic downturn that most Americans have experienced in the recent past.

At a distance the next two priorities for brands are to help clean the environment and give scholarships. This does not necessarily mean that these are not important brand contributions, but that jobs are a more prevalent contribution at this time.

Interestingly, giving employees free time to do community service was ranked as top by the smallest proportion of respondents in each cultural group. This is perhaps due to the lack of visibility that such action may have as a contribution.

What are the lessons from these findings?

  1. Cultural groups and those at different levels of acculturation tend to agree on approaches that brands need to take to give back to the communities where they operate. Clearly, the implementation of providing jobs has to be by cultural group in order to satisfy the expressed sentiment of these consumers. Creating jobs is not enough but creating jobs that satisfy these segments individually.
  2. At times of economic distress there are actions that consumers feel are important but they subside to the more pressing issues of the time. While cleaning the environment and giving scholarships are important, jobs take preeminence in economic downturns.
  3. Marketers are encouraged to emphasize how their brands contribute to employment of these different cultural groups with specific emphasis on the local community.

The data for this study was collected by Research Now of Dallas, Texas, thanks to the generous initiative of +Melanie Courtright. Research Now contributed these data to the research efforts of the Center for Hispanic Marketing Communication at Florida State University (+Hispanic FSU). This online survey included the responses of 936 Asians (398 US born), 458 African Americans, 833 Hispanics (624 US born), and 456 non Hispanic Whites. This national sample had quotas for US region, age, and gender to increase representativeness.

Tuesday, December 4, 2012

Language Preference for Television Watching by Latinos of Different Socioeconomic Levels

It has been of interest to me to explore how socioeconomic level relates to different consumer and media behaviors of Latinos in the United States. As media outlets become more abundant and as Latino growth shifts to births as opposed to sheer immigration, it is relevant to learn more about how to target Hispanics of different socioeconomic levels. In this particular instance, I am exploring the television watching behavior of Latinos according to their language of preference depending on their socioeconomic level.

Using data from the Experian Simmons National Hispanic Consumer Study that was collected in the twelve months ending on August 31, 2012, I created crosstabulations of the TGI Socio Economic Scale in the Simmons database by preference to watch television “Only in English,” “Mostly in English but Some in Spanish,” “Mostly in Spanish but Some in English,” and “Only in Spanish.” The television language preference variable in the analysis combined those who watch “Only in English” and “ Mostly in English but Some in Spanish” in one group, and those who watch in “Only in Spanish” and “Mostly in Spanish but Some in English” in another group.   Respondents stated their preference when reacting to the statement “When you watch television do you prefer to watch television programs...” The TGI Socio Economic Scale is a composite of education, ownership of selected household durables, mobile phone ownership, credit card ownership, usage of Internet and air travel. The scale results in four levels of socioeconomic standing: The top 10% of the population, the next 20% of the population, the next 30% of the population, and finally the remaining 40%.

The following line chart illustrates the trends uncovered:


As can be observed, the lowest socioeconomic level of Latinos is more likely than anyone else to prefer watching television in Spanish, although a substantive percentage of them also indicate preferring only English or mostly English television exposure. The percentages of Hispanics at this lowest level are more equally divided among language preferences than for any other socioeconomic level. Those in Level 3 are more polarized than the lowest level as their percentages are more divided between the two languages. The polarization increases at Levels 1 and 2 as they are more dramatically divided and in the large majority they prefer television exposure in the English language.

Overall, there is a tendency for those better educated and more affluent to prefer television in the English language and for those who are in the lower levels to be more oriented to the Spanish language. It is also likely that those in the higher socioeconomic levels are more acculturated into the US. The tendencies are almost linear and monotonic.


These trends point to the dynamics of the Latino market and its complexity.  While the preference to watch programming in the Spanish language continues to be important for a substantive portion of the Latino population, it is not a uniform tendency.  This is clearly due to the fact that with so many channels in English, Latinos simply find more offerings in English than in Spanish.  It is likely that the diversity of content in English drives some of these trends.  Those more affluent can be expected to have more choices of channels for the enjoyment of television programming and that may explain some of these preferences. Also, at the lower levels there are those who have been born in the United States that share their socioeconomic level with newer immigrants.  That makes for an interesting mix of acculturation stages that affect television language preferences.

Further, as Latinos become more able to appreciate content in English, their content horizons seem to expand. Socioeconomic status and bilingualism and English fluency are related.

Marketers can take from these findings important lessons and cautions:

1. Media planning is not straightforward.  Socioeconomic level plays a role and thus different types of products may do better on English language television platforms, and others on Spanish.

2. A mix of language television platforms may be appropriate for many advertising campaigns as television language preferences, particularly at Levels 3 and 4, are more divided. They represent 70% of the Latino population.

3. Language preference for television watching may not be indicative of assimilation but of content availability and content preferences.  Thus cultural insights should likely drive marketing and advertising campaigns.

This data confirms the diversity and complexity of the Latino market and the importance of sophisticated media planning efforts.

The data used here is from the Experian Simmons National Hispanic Consumer Study and was collected from August 1, 2011 to August 31, 2012. The sample contained 8120 Latinos.

Wednesday, November 14, 2012

Multicultural Technology Leadership: Tablets and Blogs

Over the past several years we have measured technology use and adoption at the Center for Hispanic Marketing Communication at Florida State University. We have consistently found that emerging minorities tend to lead in most areas of technology adoption. In 2012 with the cooperation of Research Now and the leadership of Ms. Melanie Courtright, we again collected an online national sample composed of Hispanics and Asians born in the US and those born abroad, in addition to African Americans and Non-Hispanic Whites. We used the country of birth as a proxy for acculturation to see if technology adoption varied accordingly.

Tablets are creating chaos in the computer industry because consumers are adopting them and discarding laptops, desktops, and netbooks. The following chart shows how adoption of tablets varies of by cultural group and by place of birth.


As can be seen, Asians born abroad exhibit the largest penetration of tablet current ownership and also their projected ownership in the next year. Their affluence and technological savvy may account for this trend. Hispanics not born in the US are the second group in their ownership of tablets, and their minority counterparts follow them closely. Non-Hispanic Whites, however, lag substantially. This speaks of the technology eagerness of minorities and their leadership in technology adoption.  The differences, however, appear to vanish when looking at aspirations for the next year. Thus, minorities innovate but tablets are becoming very desirable overall.

Having a blog should be a good indicator of innovativeness in web communications. The following chart illustrates the penetration of blog ownership in different cultural groups.


Current blog ownership is highest among Asians, followed by Hispanics. African Americans and Non-Hispanic Whites lag. Tendencies for the next year vary and highlight that those not born in the US are more interested in having a blog, both Latinos and Asians. African Americans also show the aspiration to have a blog in a year in sharp contrast to their current blog ownership. Non-Hispanic Whites seem less eager to have a blog now and in the future, and interestingly Asians born in the US are at the same level as Non-Hispanic Whites in their future blog ownership.

Overall, these trends are puzzling and definitely should ignite the imagination of technology marketers. The relative popularity of blogs and their future growth indicate the social eagerness of minority groups. Culturally, blogs provide an outlet for creativity, expression, and a voice that minorities did not have before.  Marketers can take advantage of this eagerness by using these growing blogs as advertising venues for reaching out to minority networks, for example.

The phenomenal adoption of tablets and their appeal for the near future are more striking.  Mobile advertising will become increasingly powerful and tablets will be the new platform for communication. That minorities are leading now should give food for thought to marketers that are trying to predict future trends and understand where their brands will be in the near future.

The data for this study was collected by Research Now of Dallas, Texas, thanks to the generous initiative of Ms. Melanie Courtright. Research Now contributed these data to the research efforts of the Center for Hispanic Marketing Communication at Florida State University. This online survey included the responses of 936 Asians (398 US born), 458 African Americans, 833 Hispanics (624 US born), and 456 non Hispanic Whites. This national sample had quotas for US region, age, and gender to increase representativeness.

Wednesday, October 31, 2012

Hispanic Attitudes and Behaviors by Socioeconomic level: Implications for Marketers

When talking about US Hispanics marketers seldom explore socioeconomic level as it relates to their attitudes and behaviors.  For me this is a most interesting relationship because if, for example, Latinos hold cultural attitudes in the same esteem regardless of their social standing, then one may conclude that one marketing approach may reach diverse types of Hispanics.
What should the marketer tell Hispanic consumers when selling a new Toyota Camry? Or what should the marketer tell Latinos when selling diapers? Should the communication and positioning approaches used be equally crafted to reach the Hispanic that can afford a new relatively expensive car, or a more common product like diapers?
Using data from the Experian Simmons National Hispanic Consumer Study that was collected in the twelve months ending on June 1, 2012, I created crosstabulations of the TGI Socio Economic Scale in the Experian Simmons database by those “agreeing a lot” with cultural attitudes and behaviors that will be specified below.  The TGI Socio Economic Scale is a composite of education, ownership of selected household durables, mobile phone ownership, credit card ownership, usage of Internet and air travel. The scale results in four levels of socio-economic standing: The top 10% of the population, the next 20% of the population, the next 30% of the population, and finally the remaining 40%.
The bar charts below report the percentage of Latinos in each of the Socio Economic Level that stated they “agree a lot” with each of the cultural statements.
The way to read these results is, for example:  Of those Latinos that are in the lowest 40% of the TGI Socio Economic scale, 30% “agree a lot” with “I often encourage Hispanic children to participate in traditional Hispanic games and activities,” and 25%  those in the next higher 30% level state they “agree a lot” with the statement.  Twenty percent in the next higher level and only about 16% in the highest Socio Economic level similarly “agree a lot.”   Meaning that strong agreement with the statement is heavily concentrated in the lower socioeconomic classes. There is a monotonic trend that indicates that as Socio Economic Level rises, attitudes and behaviors endorsing Latino cultural elements decrease. There are other attitudes and behaviors that do not conform with the above trend, for example:


The cultural value of being gregarious and enjoying family and extended family appears to be consistent across Socio Economic Levels, and to an even higher extent at the upper levels of the Socio Economic scale.  In general, however, the percentages are very high and they speak more readily about how certain cultural values persist even as people become wealthier and more educated. It appears, then, that some values and behaviors decline as Hispanics climb the social ladder and others persist regardless. This highlights the complexity of the Hispanic market. Further, those higher in the Socio Economic scale are more likely to endorse values of US society as reflected in the chart below regarding the priority of speaking English in the household.


The findings are consistent and surprising, in my opinion.  Those who are less affluent and less formally educated are the largest share of those indicating they engage in culturally related behaviors as well as holding attitudes and beliefs that are culturally based. Nevertheless there appear to be values that survive Latino prosperity like the value for family get togethers. It may be that those better off have more family around to get together with and that those less well off tend to be more geographically separated because of lack of economic resources.

These findings corroborate what our book “Hispanic Marketing: Connecting with the New Latino Consumer” says about how lower socioeconomic classes are more likely to be attached to their culture to a larger extent. It is also likely that having roots, of any kind, is more important to those who have not fared as well in society. Nevertheless, this data shows that there are exceptions and that more affluent Latinos are likely to endorse US values to a larger extent. That may not be too surprising but certainly the trend points to the importance of Socio Economic Level considerations in marketing to Hispanics.

Another factor to point out is that recency of immigration to the US should be correlated with Socio Economic Level. That may also explain to some extent why lower levels endorse cultural attitudes and behaviors to a larger extent.

The consistencies are important and we will report some more of these in future postings. The trends have powerful implications for those who for example plan business to business campaigns, or plan approaches geared to the more affluent. In a business to business setting, if targeting relatively well to do Hispanic business owners a culturally based approach may not be as relevant as when targeting Latino employees of that business.

Three trends were highlighted here. Specific cultural attitudes and behaviors that differentiate Latinos of diverse levels and that tend to be more strongly endorsed by those in the lower 40%; Other more general cultural attitudes and behaviors that seem to be relevant to all Hispanics; And, a tendency for the better off to endorse US values to a larger extent.

Marketers should, in my opinion, pay close attention to these findings. Marketing in culture may render more robust results when campaigns are directed to the lower socioeconomic strata. It appears that cultural heritage loses some prevalence as Latinos become increasingly affluent. Thus, having a campaign in Spanish with Latino themes for better off Hispanics may not be as productive as once thought.

The data used here is from the Experian Simmons National Hispanic Consumer Study and collected from April 25, 2011 to June 1, 2012. The sample contained 8252 Latinos.

Monday, October 8, 2012

Mobile Latinos

I was quite impressed when Max Kilger, Chief Behavioral Scientist for Experian Simmons, talked to my graduate Hispanic Marketing Communication class about new data findings regarding mobile technology use by Latinos.  I was particularly impressed because the sample that Experian Simmons uses yielded similar results to the ones I have been obtaining with the sample provided to Florida State University by Research Now. Cross-validation of results is reassuring.  Basically, Hispanics are eager users of mobile technology.

Here are some of the findings reported by Dr. Kilger to my class:

First, the percentage of use of mobile phones by Hispanics and non-Hispanics over a 7 day period is almost the same for Hispanic and non-Hispanics, with non-Hispanics having a 4 percentage point lead as seen in the chart below.  The Latino percentage of mobile use in one day, however, is about 4 percentage points higher.


Clearly, the small differences highlighted are interesting but almost trivial.  What matters here is that Hispanics are eager users of mobile phones, at least as much as the rest of the market combined. In prior blog postings I have presented data which shows that Hispanics, African Americans, and Asians use their mobile phones about double the amount of time as their non-Hispanic White counterparts. That suggests that when looking at all non-Hispanics combined it is likely that minorities are the ones responsible for much of the usage.

The next chart is more dramatic, not so much in terms of actual differences but in the fact that Latinos are eager to adopt new technologies and that when they adopt them they use them more. Here is the trend in terms of Tablet use.


While the penetration of tablets among Hispanics is not yet as high as among other cultural groups, Latinos who have them are more likely to use them. That comes as no surprise given the findings I have reported in the past couple of years. Technologies that allow for more fluid interpersonal communication and mobility have shown to be very attractive to Hispanics. My interpretation is that this is due to the eagerness that Latinos have to be connected. New technologies appear to be in fact “technologies of liberation” for Latinos.  Liberation in the sense that the constraints impeding interconnection among Hispanics are being removed by these electronic machines.


Another two charts that impressed me have to do with activities that Latinos engage in on their mobile phones.


Perhaps not surprisingly, Hispanics overindex in their use of text messaging, IM/Chat, and to a smaller degree in social networking.  My guess is that if these data were broken down further by cultural group we would see that minorities in general overindex in social networking as we have seen with our FSU data before.  That Latinos engage in mobile phone listening to music to a larger degree than anyone else confirms their attraction to music as part of their cultural existence.


It would be most interesting if the Experian Simmons data were broken down by different cultural groups so that comparisons could be made in more detail. Comparing culturally diverse groups among themselves can be illuminating for segmentation purposes.

My students and I were gratified to see that the Experian Simmons data supported the results we had found with the data from Research Now, and this confirmation lends credibility to the fact that Latinos are eager technology users who lead in many digital domains.

The data from which the above results are reported is from the Simmons Connect Study with a cross-platform sample of Hispanics of over 7,000 respondents.

Monday, September 17, 2012

Cultural Attitudes and Language Preference of Hispanics: Marketing Implications

Do attitudes towards Latino culture change depending on the language preference of Hispanics? This is a question that has importance to marketers and service providers.  If cultural attitudes differ for those who prefer to speak English and those who prefer to speak Spanish then one can conclude that language preference is also an indicator of how close one is to one’s own culture. If on the contrary, cultural attitudes do not differ or differ to a small extent between English and Spanish preferred Latinos, then one can conclude that the overall Latino culture persists regardless of current language preference.

Using data from the Simmons National Hispanic Consumer Study that was collected in the twelve months ending on March 16, 2012, I created crosstabulations of language preference by cultural attitudes among Hispanics. Language preference was gauged as the language the respondent prefers to speak in general and the response categories were Only English, Mostly English but Some Spanish, Mostly Spanish but Some English, and Only Spanish. For this analysis I collapsed Only and Mostly English and Only and Mostly Spanish to form the preferences for English or Spanish.

Cultural attitudes were measured with a Likert type scale “Agree a lot,” Agree a little,” “Neither agree nor disagree,” “Disagree a little,” and Disagree a Lot.”  The items to agree or disagree with were:  

  • I believe it is important to teach Spanish to Hispanic Children as a way to help preserve Hispanic culture
  • I have more Hispanic friends than non-Hispanic friends
  • I make an effort to have my personal appearance reflect that I am Hispanic/Latino
  • Speaking English in our home is a priority in our Household
  • Speaking Spanish in our home is a priority in our Household

The two agree response categories in the scale were added up to have an overall agreement percentage.  The following chart shows the average percentages for those who prefer to speak English and those who prefer to speak Spanish for each of the attitudes.


The reader can see that generally speaking those who prefer to communicate in English exhibit a lesser priority in endorsing items that reflect a cultural attachment.  In particular, and in a somewhat obvious way, those who prefer to speak in English express that Speaking English at home is more of a priority for them than for their Spanish preferred counterparts. That trend is strongly reversed for those who prefer to speak Spanish as they indicate a very strong priority for Spanish to be the language of the home.

What is counterintuitive and revealing is that a large majority of those who prefer to speak English indicate that teaching Spanish to Children is a way to help preserve Hispanic culture. To me that means that preferring to speak English does not necessarily mean that the Spanish language is not highly thought of.

That those that prefer Spanish have more Hispanic friends than those who prefer English is not surprising.  The social networks of those who prefer English are likely to be wider and more diversified. Those who prefer Spanish are likely to live and work in conditions that may be somewhat  more segregated.

While a Latino personal appearance is not highly important in general, those who prefer Spanish endorse it to a larger extent.  And that is not very surprising either, because as one’s circles and circumstances expand one is more likely to also acquire the styles of those varied groups.

The main lesson for marketing, from my point of view is that while language preference does differentiate Latinos’ cultural attitudes, positive attitudes towards cultural elements persist among those who prefer to speak English.  In particular this is true when it comes to the education of children. It is an ambition to have one’s kids learn Spanish as a proxy for preserving the culture.

The moral of the story is that while Hispanics may be acculturating and switching to English as they stay longer in the United States, their loyalty to their heritage appears to persist.  Thus, cultural messages are likely to be a key link to reaching out to Hispanics be they Spanish or English preferred.

The data used here is from the Simmons National Hispanic Consumer Study and collected from January 31, 2011 to March 16, 2012. The sample contained 3,518 English preferred Latinos, and 2,104 Spanish preferred Hispanics.

Friday, September 7, 2012

Political Affiliation and Attitudes of Hispanics

In this heated political season of the Fall of 2012, when the different political parties are trying to get the attention of Hispanics it is of interest to explore how the political affiliation of Hispanics relates to some of their attitudes.

With online data collected by Research Now of Dallas Texas, for the Center for Hispanic Marketing Communication at Florida State University, I explore here a variety of attitudes as they relate to the political affiliation of Hispanic respondents. Affiliation was measured by asking respondents “Could you please tell us your political affiliation?” and the answer categories were Republican, Democrat, Independent, and No Party Affiliation, as well as the opportunity to refuse to answer. The attitude items were statements to which respondents could answer any number from 5 to 0, where 5 meant “Completely Agree” and 0 meant “Completely Disagree.”

Independent respondents were more likely to state  the economic crisis has made them more frugal in their purchases than other respondents. They were followed by those with no party affiliation. Republicans and Democrats were somewhat less likely to agree with the statement.


Still, in the context of a scale from 0 to 5, there was a general sense that frugality has been a factor in these consumers’ lives.  Perhaps Independent respondents and those with no party affiliation have opted for those responses because they are politically dissatisfied.

Interestingly, when asked about worrying about retirement, the trend is somewhat different.


In the case of worrying about retirement, Republicans and Democrats seem to be more worried than their counterparts. Again, in the context of the scale we used, this is a concern to many Latinos, in general.  

The use of coupons can be construed as an indicator of economic concern.


Here the reader can see a monotonic decline of habitual use of coupons with political affiliation, from Republican to No party affiliation.  Is it the case that those with a party affiliation are somewhat more systematic in organizing their purchases?

These days it is common for companies to endorse the idea that they need to give back to the communities they benefit from. 


Democrats and Independents are more likely to agree that they favor the companies that give back to the community. This is perhaps associated with socioeconomic status and with a more socially oriented philosophy.

Voting along the lines of political affiliation is obviously more prevalent among Democrats and Republicans. This is perhaps not surprising but the trend confirms that there is a sense of loyalty to the party.


There are many politicians and advertising strategists who believe that to influence Hispanics they need to use Latinos models and that influence is likely to come from other Latinos.


While there are some small differences among affiliations regarding the feeling that one is more influenced politically by others of one’s own ethnic group, the overall level of agreement is very low. This means to me that the influence regarding Latino political behavior is more based on issues and party affiliation than on the ethnicity of influencers.

Similarly, regarding advertising, we find that while there are some differences regarding the influence of others who share a Latino ethnicity, overall the ethnicity of the people featured in the ads does not seem to be highly important.


This may be due to the fact that Latinos come in all colors and that the party affiliation and issues are more important than the ethnicity of the characters in ads. Republicans are particularly less likely to be influenced by the ethnicity of the advertising portrayals.

Overall one can conclude that political affiliation does seem to have a relationship with attitudes about the economy, even though everyone seems to be affected by economic conditions  in general. Further, political affiliation seems to be a matter of loyalty particularly for Republicans and Democrats. The ethnicity of influencers, however, does not seem to be that important to these online consumers.

The data for this study was collected by Research Now of Dallas, Texas, thanks to the generous initiative of Ms. Melanie Courtright. Research Now contributed these data to the research efforts of the Center for Hispanic Marketing Communication at Florida State University.  This national sample had quotas for US region, age, and gender to increase representativeness. The distribution of political affiliations was as follows:


Wednesday, September 5, 2012

Language Preference of Hispanics and Perceptions of Financial Well Being: Implications for Marketing

To what extent has the financial situation affected the perceptions of financial well-being of Latinos depending on their language preference? This question has implications because the answer may impact the way in which consumers make purchase decisions.

Language preference among Hispanics has been considered a proxy for acculturation. It is also an indicator of the many aspects of life that impact Hispanics from media preferences to interpersonal interactions. The anti-immigration sentiment prevalent in many circles in the US these days has hurt recent immigrants in particular. In addition, economic circumstances in the past few years are likely to have affected Latinos differentially depending on their integration in the US.

Using data from the Simmons National Hispanic Consumer Study that was collected in the twelve months ended on March 16, 2012, I created crosstabulations of language preference by financial outlook among Hispanics. Language preference was gauged as the language the respondent prefers to speak in general and the response categories were Only English, Mostly English but Some Spanish, Mostly Spanish but Some English, and Only Spanish. For this analysis I collapsed Only and Mostly English and Only and Mostly Spanish to form the preferences for English or Spanish.

The financial outlook dimension was measured with the question: Do you think you are better off or worse off financially now than you were 12 months ago? The response categories were Significantly Worse Off, Somewhat Worse Off, About the Same, Somewhat Better Off, and Significantly Better Off. For the purposes of this analysis I collapsed those who answered significantly and somewhat worse off, and those who answered significantly and somewhat better off to result in three categories: Better Off, About the Same, and Worse Off.

The resulting “average” table is presented below:


The plurality, over 30% of Latinos indicate that their financial situation is about the same as it was 12 months ago. This can mean different things.  It can mean that things have not improved or that things have been as good as they were a year ago. Given the economic situation the US is going through, most likely it means that things have not improved but not gotten worse. Also, the “fatalism” prevalent in the culture may lead many to express that things are the same as usual and that in the average there is no change.

English preferred Hispanics, however, have a much more positive perspective than Spanish preferred Latinos as a substantively larger percentage of them indicate they are better off now than 12 months ago than their Spanish preferred counterparts. This may not be completely surprising since Spanish preferred respondents are more likely to be more recent immigrants and also more likely to suffer the consequences of immigration policies. These more recent immigrants are also more likely to have suffered from lack of work due to the lack of jobs in industries like construction that have traditionally employed many recent immigrants from Mexico and other parts of Latin America.

In a somewhat contradictory fashion, a few more English preferred Hispanics also report being worse off now than Spanish preferred respondents, but the differences between these two groups are very small. What is interesting is that over 25% of Latinos feel things have been worse for them in general. While not surprising, these figures bring home the notion that the economy and immigration related issues are likely to have made life worse for many Hispanics who try hard to make a living for themselves and their families.

The news for marketers are mixed.  The majority of Hispanics feel they are better off or about the same as they were 12 months ago, and that is good news as that means that spending by most Latinos is likely to continue at a sustained pace. The negative news are that a substantial percentage feel the brunt of pervasive immigration and economic conditions and that their spending may be limited by their actual and perceived spending power. This brings about the importance of making politicians aware that the uncertainty of immigration reform needs to be removed for economic growth. The clarification of immigration policies and rules is likely to make the future more predictable and optimistic for many. Also, as in the overall economy, job creation should be a most important priority.

The data used here is from the Simmons National Hispanic Consumer Study and collected from January 31, 2011 to March 16, 2012. The sample contained 3,518 English preferred Latinos, and 2,104 Spanish preferred Hispanics.