Do attitudes towards Latino culture change depending on the language preference of Hispanics? This is a question that has importance to marketers and service providers. If cultural attitudes differ for those who prefer to speak English and those who prefer to speak Spanish then one can conclude that language preference is also an indicator of how close one is to one’s own culture. If on the contrary, cultural attitudes do not differ or differ to a small extent between English and Spanish preferred Latinos, then one can conclude that the overall Latino culture persists regardless of current language preference.
Using data from the Simmons National Hispanic Consumer Study that was collected in the twelve months ending on March 16, 2012, I created crosstabulations of language preference by cultural attitudes among Hispanics. Language preference was gauged as the language the respondent prefers to speak in general and the response categories were Only English, Mostly English but Some Spanish, Mostly Spanish but Some English, and Only Spanish. For this analysis I collapsed Only and Mostly English and Only and Mostly Spanish to form the preferences for English or Spanish.
Cultural attitudes were measured with a Likert type scale “Agree a lot,” Agree a little,” “Neither agree nor disagree,” “Disagree a little,” and Disagree a Lot.” The items to agree or disagree with were:
- I believe it is important to teach Spanish to Hispanic Children as a way to help preserve Hispanic culture
- I have more Hispanic friends than non-Hispanic friends
- I make an effort to have my personal appearance reflect that I am Hispanic/Latino
- Speaking English in our home is a priority in our Household
- Speaking Spanish in our home is a priority in our Household
The two agree response categories in the scale were added up to have an overall agreement percentage. The following chart shows the average percentages for those who prefer to speak English and those who prefer to speak Spanish for each of the attitudes.

The reader can see that generally speaking those who prefer to communicate in English exhibit a lesser priority in endorsing items that reflect a cultural attachment. In particular, and in a somewhat obvious way, those who prefer to speak in English express that Speaking English at home is more of a priority for them than for their Spanish preferred counterparts. That trend is strongly reversed for those who prefer to speak Spanish as they indicate a very strong priority for Spanish to be the language of the home.
What is counterintuitive and revealing is that a large majority of those who prefer to speak English indicate that teaching Spanish to Children is a way to help preserve Hispanic culture. To me that means that preferring to speak English does not necessarily mean that the Spanish language is not highly thought of.
That those that prefer Spanish have more Hispanic friends than those who prefer English is not surprising. The social networks of those who prefer English are likely to be wider and more diversified. Those who prefer Spanish are likely to live and work in conditions that may be somewhat more segregated.
While a Latino personal appearance is not highly important in general, those who prefer Spanish endorse it to a larger extent. And that is not very surprising either, because as one’s circles and circumstances expand one is more likely to also acquire the styles of those varied groups.
The main lesson for marketing, from my point of view is that while language preference does differentiate Latinos’ cultural attitudes, positive attitudes towards cultural elements persist among those who prefer to speak English. In particular this is true when it comes to the education of children. It is an ambition to have one’s kids learn Spanish as a proxy for preserving the culture.
The moral of the story is that while Hispanics may be acculturating and switching to English as they stay longer in the United States, their loyalty to their heritage appears to persist. Thus, cultural messages are likely to be a key link to reaching out to Hispanics be they Spanish or English preferred.
The data used here is from the Simmons National Hispanic Consumer Study and collected from January 31, 2011 to March 16, 2012. The sample contained 3,518 English preferred Latinos, and 2,104 Spanish preferred Hispanics.
In this heated political season of the Fall of 2012, when the different political parties are trying to get the attention of Hispanics it is of interest to explore how the political affiliation of Hispanics relates to some of their attitudes.
With online data collected by Research Now of Dallas Texas, for the Center for Hispanic Marketing Communication at Florida State University, I explore here a variety of attitudes as they relate to the political affiliation of Hispanic respondents. Affiliation was measured by asking respondents “Could you please tell us your political affiliation?” and the answer categories were Republican, Democrat, Independent, and No Party Affiliation, as well as the opportunity to refuse to answer. The attitude items were statements to which respondents could answer any number from 5 to 0, where 5 meant “Completely Agree” and 0 meant “Completely Disagree.”
Independent respondents were more likely to state the economic crisis has made them more frugal in their purchases than other respondents. They were followed by those with no party affiliation. Republicans and Democrats were somewhat less likely to agree with the statement.

Still, in the context of a scale from 0 to 5, there was a general sense that frugality has been a factor in these consumers’ lives. Perhaps Independent respondents and those with no party affiliation have opted for those responses because they are politically dissatisfied.
Interestingly, when asked about worrying about retirement, the trend is somewhat different.

In the case of worrying about retirement, Republicans and Democrats seem to be more worried than their counterparts. Again, in the context of the scale we used, this is a concern to many Latinos, in general.
The use of coupons can be construed as an indicator of economic concern.

Here the reader can see a monotonic decline of habitual use of coupons with political affiliation, from Republican to No party affiliation. Is it the case that those with a party affiliation are somewhat more systematic in organizing their purchases?
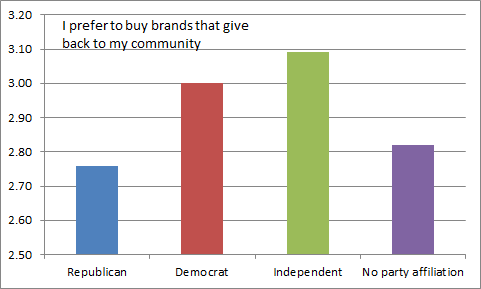
These days it is common for companies to endorse the idea that they need to give back to the communities they benefit from.

Democrats and Independents are more likely to agree that they favor the companies that give back to the community. This is perhaps associated with socioeconomic status and with a more socially oriented philosophy.
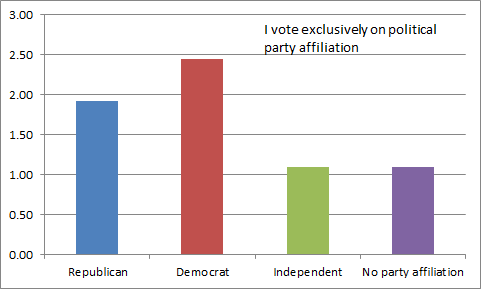
Voting along the lines of political affiliation is obviously more prevalent among Democrats and Republicans. This is perhaps not surprising but the trend confirms that there is a sense of loyalty to the party.

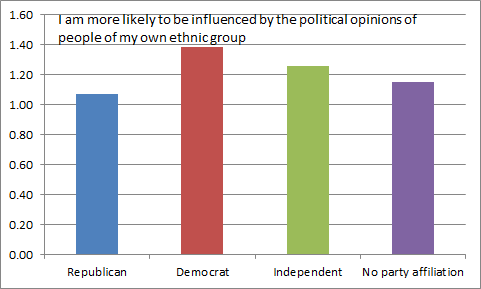
There are many politicians and advertising strategists who believe that to influence Hispanics they need to use Latinos models and that influence is likely to come from other Latinos.

While there are some small differences among affiliations regarding the feeling that one is more influenced politically by others of one’s own ethnic group, the overall level of agreement is very low. This means to me that the influence regarding Latino political behavior is more based on issues and party affiliation than on the ethnicity of influencers.
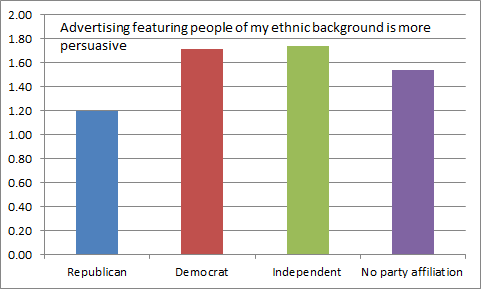
Similarly, regarding advertising, we find that while there are some differences regarding the influence of others who share a Latino ethnicity, overall the ethnicity of the people featured in the ads does not seem to be highly important.

This may be due to the fact that Latinos come in all colors and that the party affiliation and issues are more important than the ethnicity of the characters in ads. Republicans are particularly less likely to be influenced by the ethnicity of the advertising portrayals.
Overall one can conclude that political affiliation does seem to have a relationship with attitudes about the economy, even though everyone seems to be affected by economic conditions in general. Further, political affiliation seems to be a matter of loyalty particularly for Republicans and Democrats. The ethnicity of influencers, however, does not seem to be that important to these online consumers.
The data for this study was collected by Research Now of Dallas, Texas, thanks to the generous initiative of Ms. Melanie Courtright. Research Now contributed these data to the research efforts of the Center for Hispanic Marketing Communication at Florida State University. This national sample had quotas for US region, age, and gender to increase representativeness. The distribution of political affiliations was as follows:

To what extent has the financial situation affected the perceptions of financial well-being of Latinos depending on their language preference? This question has implications because the answer may impact the way in which consumers make purchase decisions.
Language preference among Hispanics has been considered a proxy for acculturation. It is also an indicator of the many aspects of life that impact Hispanics from media preferences to interpersonal interactions. The anti-immigration sentiment prevalent in many circles in the US these days has hurt recent immigrants in particular. In addition, economic circumstances in the past few years are likely to have affected Latinos differentially depending on their integration in the US.
Using data from the Simmons National Hispanic Consumer Study that was collected in the twelve months ended on March 16, 2012, I created crosstabulations of language preference by financial outlook among Hispanics. Language preference was gauged as the language the respondent prefers to speak in general and the response categories were Only English, Mostly English but Some Spanish, Mostly Spanish but Some English, and Only Spanish. For this analysis I collapsed Only and Mostly English and Only and Mostly Spanish to form the preferences for English or Spanish.
The financial outlook dimension was measured with the question: Do you think you are better off or worse off financially now than you were 12 months ago? The response categories were Significantly Worse Off, Somewhat Worse Off, About the Same, Somewhat Better Off, and Significantly Better Off. For the purposes of this analysis I collapsed those who answered significantly and somewhat worse off, and those who answered significantly and somewhat better off to result in three categories: Better Off, About the Same, and Worse Off.
The resulting “average” table is presented below:

The plurality, over 30% of Latinos indicate that their financial situation is about the same as it was 12 months ago. This can mean different things. It can mean that things have not improved or that things have been as good as they were a year ago. Given the economic situation the US is going through, most likely it means that things have not improved but not gotten worse. Also, the “fatalism” prevalent in the culture may lead many to express that things are the same as usual and that in the average there is no change.
English preferred Hispanics, however, have a much more positive perspective than Spanish preferred Latinos as a substantively larger percentage of them indicate they are better off now than 12 months ago than their Spanish preferred counterparts. This may not be completely surprising since Spanish preferred respondents are more likely to be more recent immigrants and also more likely to suffer the consequences of immigration policies. These more recent immigrants are also more likely to have suffered from lack of work due to the lack of jobs in industries like construction that have traditionally employed many recent immigrants from Mexico and other parts of Latin America.
In a somewhat contradictory fashion, a few more English preferred Hispanics also report being worse off now than Spanish preferred respondents, but the differences between these two groups are very small. What is interesting is that over 25% of Latinos feel things have been worse for them in general. While not surprising, these figures bring home the notion that the economy and immigration related issues are likely to have made life worse for many Hispanics who try hard to make a living for themselves and their families.
The news for marketers are mixed. The majority of Hispanics feel they are better off or about the same as they were 12 months ago, and that is good news as that means that spending by most Latinos is likely to continue at a sustained pace. The negative news are that a substantial percentage feel the brunt of pervasive immigration and economic conditions and that their spending may be limited by their actual and perceived spending power. This brings about the importance of making politicians aware that the uncertainty of immigration reform needs to be removed for economic growth. The clarification of immigration policies and rules is likely to make the future more predictable and optimistic for many. Also, as in the overall economy, job creation should be a most important priority.
The data used here is from the Simmons National Hispanic Consumer Study and collected from January 31, 2011 to March 16, 2012. The sample contained 3,518 English preferred Latinos, and 2,104 Spanish preferred Hispanics.