Pages

Showing posts with label Simmons. Show all posts

Friday, August 23, 2013

Fashion, Style, and Culture: The Case of US Latinos

Retailers often talk about how Hispanics are different in their approach to dress, clothing, and fashion. There has been coverage in the press about how some shopping centers are morphing themselves into Latino shopping centers to better serve their local communities and stay in business.

From casual observation I know that Hispanics dress up to go out on the weekends and kids are very well dressed to go to church and other activities, even when going on airplanes. The attention to dress and detail to style is apparent in a great number of cases. Many Latinos spend much of their leisure time in stores and malls enjoying their free time with their families and becoming informed about fashion and style. I have observed the more sensual approach to dressing by both Hispanic men and women. What are the attitudes that underlie this attention to style and fashion?

To answer the above question, I used the data from the Experian Marketing Services Simmons National Hispanic Consumer Study, that was collected between January 30, 2012 and March 13, 2013. The chart below shows differences in “any agree” (agree a lot plus agree a little) with the attitudinal statements about style and fashion with which Latinos were more likely to agree:


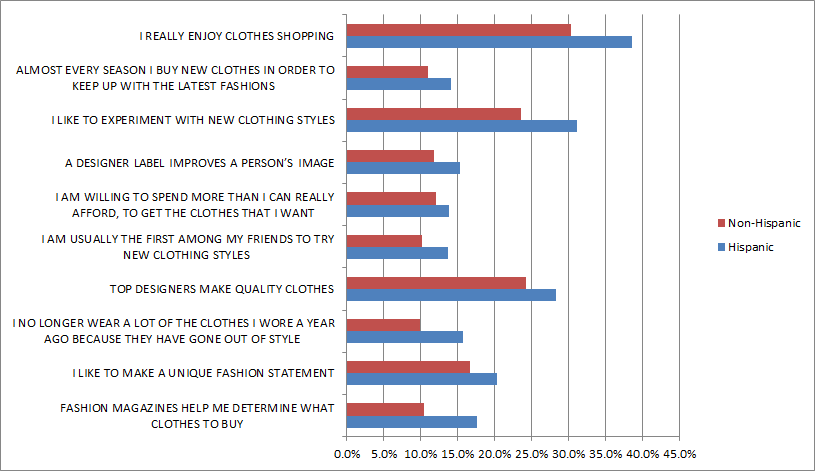
As observed above, Hispanics are more likely than non-Hispanics to be feel they are opinion leaders about clothes and fashion. They also are more likely to trust top designers and to trade up to newer designs faster than non-Hispanics.

Latinos are more likely to be influenced by fashion magazines and most importantly, Latinos enjoy more the activity of shopping for clothes. And Hispanics are also more experimental in the approaches to clothing and style.

What does these trends tell us? I think that Latinos are now influencers in fashion that need to be carefully watched as their tastes and preferences evolve. Marketers need to be pay attention to these trendsetters as their numbers and influence increases in the US.

Further, the eagerness these Hispanic consumers show to be in style, corroborates that merchandising for them is not necessarily the same as what is traditionally done for the rest of the population. Interestingly, the contrast of the attitudes on which non-Hispanics exceed Hispanics are interesting as documented in the chart below:


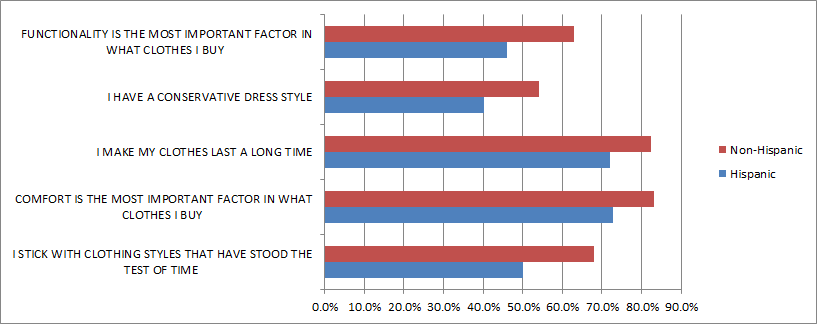
As can be seen non-Hispanics are the ones who are more likely to express conservative style and clothing attitudes. This trend adds evidence to the observation that Latinos are more likely to lead in dress, fashion, and style.  In terms of profitability and trend making marketers need to be be aware of the differences that Latinos represent for the future of their brands and retailing activities.

Clearly, examining the trends in the charts above suggests that conservatism is in general a more pervasive trends that leadership and innovativeness.  The percentages of conservative attitudes are higher. Still, where Hispanics excel is in having larger minorities that express an eagerness to change and innovate regarding style.

What can marketers do? Include more Latinos/Latinas in their approaches to marketing, regardless of whether or not their approach is a “Total Market” or more targeted approach. The voice of Hispanics needs to be over-represented in strategies that are forward looking. Further, Latinos need to be considered as opinion leaders and co-opted to represent your brands as they are more likely to genuinely embrace innovation and change.

The moral of the story is that there is no general market and that Latinos are shaping marketing futures.

The data used here is from Experian Marketing Services’ Simmons National Hispanic Consumer Study of adults 18+ -and was collected from January 30, 2012 to March 13,, 2013. The sample of Hispanics contains 7,982 individuals and the non-Hispanic sample has 16,870 people.

Thursday, July 25, 2013

The Latino Beer Story in the US

When growing up in Mexico City, I never imagined that Corona Extra would become the international prestige beer par excellence. Please do not take me wrong, I am proud that a Mexican beer brand has become so prestigious and popular around the world, but those early experiences were quite contrasting.

Corona Extra, along with Victoria, Sol, and a few other “low-end” brands, were the cheap beer brands that were consumed by people with scarce resources. These brands were popular at lunchtime at construction sites as workers would gather to eat tortillas, hot peppers, and other foods and drink those beer brands. The brands that at the time were considered prestigious in Mexico were Bohemia, Dos Equis, Modelo, and a few others.

Well, now Corona is seen as a prestige brand even among Mexicans, both in Mexico and in the US. I have heard consumers say that they feel proud that a Mexican beer brand has become the coveted brand of well to-do people in the US and in other places around the world. Because of this association the brand has acquired the connotation of national pride, and consequently Mexicans have increased their consumption. Clearly, it is not only those of Mexican origin, but many Latinos from different origins also share this affinity with Corona Extra, even though the largest share of Hispanics in the US is still Mexican, by far.

To quantify some of my impressions, I used the data from the Experian Marketing Services Simmons National Hispanic Consumer Study, adults 21+, that was collected between January 30, 2012 and March 13, 2013. Hispanics over-index versus non-Hispanics (123 vs. 96) in their drinking of imported beer. The percentages of those stating they drink imported beer are in the chart below:


And the consumption of imported beer tends to be largely in its “regular” or full calorie version.


Regular beer has a fuller flavor and that seems to be the preference of Latinos and non-Latinos alike. So, then, what about domestic beer consumption? The following chart provides the distribution for regular domestic beer and light/low-calorie.


As can be seen, when it comes to domestic brands, light/low-calorie brands have an advantage over regular beer brands. This may be explained by the higher cost of imported beer in the US: if the consumer is going to splurge, it may as well be for the full-flavor version of their preferred imported brand. That domestic brands are more likely to be consumed in general is not surprising because of their price point. Still, Latinos are more likely to drink beer from other countries than their non-Hispanic counterparts.

Now, going back to the initial question. How is Corona Extra doing along with some of the other larger imported beer brands? The chart below presents those brands that have a 2% or larger share of being the imported brands “most often” consumed among either Hispanics or non-Hispanics.


This is confirmatory of my qualitative observations. Corona is by far the largest import “most often” drunk by Hispanics followed by Heineken and other popular Mexican brands. Interestingly, non-Hispanics, who made the Corona brand popular, do not match the enthusiasm of Latinos for the brand.

Another consideration here is that advertising and marketing seem to work well. As the reader can intuitively confirm, those brands with more advertising and promotional efforts do better in the preference of consumers. This is not surprising but should serve as a reminder to marketers on how important it is to continue connecting with consumers in order to keep their preference. That Hispanics drink more of even Heineken (a Dutch brand) provides an indication of how important is the brand-consumer connection and in a cultural way. Heineken, not being a Latin American brand, has been proactive in attracting Latinos with culturally relevant messages. And by the way, please consider the notion that all marketing is cultural, because we are all acculturated in a particular cultural context and our tastes, preferences, and even dreams are shaped by that culture.

The domestic beer brands most often consumed by Latinos and non-Hispanics are also the ones that advertise the most: Budweiser, Bud Light, Coors, Coors Light, Miller, and Miller Lite. Here, however, there is a different story that I will detail at a future time.

The data used here is from Experian Marketing Services’ Simmons National Hispanic Consumer Study of adults 21+ -and was collected from January 30, 2012 to March 13,, 2013. The sample of Hispanics contains 7,425 individuals and the non-Hispanic sample has 16,278 people.

Wednesday, June 5, 2013

The Juice Mystique: Hispanic and Non-Hispanic Consumption of Orange Juice Brands and Drinks

I have spent quite a few years asking consumers about their consumption of orange juice and juice drinks. In visiting stores that cater to Latinos in Texas and California I tend to see large displays of shelf stable drink products like Tampico and Sunny Delight. Over the years I have heard Hispanic consumers state that these products have high percentages of juice in them, as high as 80% and sometimes even higher. Which is surprising because the actual juice content is low.  I was not sure about the extent to which the consumption of these juice beverages was higher or lower than popular orange juice brands.


To obtain a quantitative picture I examined data from the Experian Marketing Services Simmons National Hispanic Consumer Study that was collected in the twelve months ending on November 30, 2012.  The results I obtained provide an interesting perspective on the use of these products according to the chart below.


First I need to clarify I decided to compare Tampico and Sunny Delight with Minute Maid and Tropicana because these are large orange juice brands, and also included Jumex because the brand has its origin in Mexico and is well known by Latinos of Mexican origin.


The chart shows that even though Tampico and Sunny Delight are used by Hispanics to a larger extent than by other consumers, the prevalence of the use of those brands is relatively low when compared with major US brands like Minute Maid and Tropicana. Jumex orange juice is used at about the same rate as the Tampico and Sunny Delight beverages. It is salient to notice that Tampico and Jumex have a very prevalent Latino constituency. That may be explained by the affinity of the Tampico brand, since Tampico is a port in Mexico, and by the heritage of Jumex whose name comes from the roots “jugos” juice, and “mexicanos” Mexican.


Interestingly, Hispanics over-index non-Hispanics in the use of all the brands. I was expecting that they would over-index more markedly in their use of the less expensive beverages but that is not the case. Given their family orientation and their larger household size, Latinos consume more of these beverages regardless of their pricing or quality. Many have argued that Hispanics are likely to purchase their preferred brands or more expensive brands for their family even if their incomes are lower. These findings may provide a partial indication of that possibility.


Out of curiosity I decided to check on income levels by use of these brands to ascertain whether or not income is associated with their use, for Hispanics and non-Hispanics. The charts below show the results.


As can be seen there is a tendency for those with lower incomes to be more likely to use Tampico and Sunny Delight, as well as Jumex orange juice regardless of their Latino heritage. And in the case of Minute Maid and Tropicana the difference by income levels is small but somewhat slanted towards higher incomes, particularly in the case of Tropicana. What seems outstanding (thanks William Biggs) is that those in the lower income categories use the premium OJ brands much more, in general, than they use the lower priced products. It can be concluded then that lower income is somewhat of a driver in the use of fruit beverages like Tampico, Sunny Delight, and Jumex OJ, but marginally the opposite in the use  of major brand orange juices. Lower price points are more appealing to some of those with lower incomes, and perhaps these consumers justify their choices by attributing higher juice content to beverages that do not have such.

It stands out that even those with lower incomes are more likely to consume premium brand orange juice, than the less expensive counterparts. Thus the selectivity of diluted drinks and less expensive brands may be particular to some who knowingly find them appealing, or who do not know what the nature of the product is.


Clearly, if Latino consumers and non-Latino consumers of lower incomes and large families see a large container of an orange drink and believe it contains a large amount of juice and then compare the price with actual 100% juice products, they are likely to opt for the larger and less expensive product. But what if they compared labels carefully?


In a competitive market there is room for juice brands to more directly  and aggressively compete with products that have a small percentage of juice content by educating consumers as to what the differences are. Clearly, the less expensive products also have some benefits as they are enriched with vitamins.  If a brand has a true advantage it should exploit it to the benefit of their bottom line and their consumer base.


At any rate, there is ample room for marketers to better understand the consumer behavior of Latinos to more successfully market to and educate them. Latinos generally want the best for their families, and highlighting product differences for them may be helpful and also profitable.


The data used here is from Experian Marketing Services’ Simmons National Hispanic Consumer Study of adults 18+  and was collected from October 24, 2011 to November 30, 2012. The sample of Hispanics contains 8,521 individuals and the non-Hispanic sample has 17,043 people.

Friday, May 10, 2013

Brands Make a Difference: Latinos Over Index in the Hair Styling Product Category


I have been conducting ethnographic interviews with Hispanics in the last several months and have visited many homes and talked to many Latino women. I have looked at their bathrooms and bedrooms and have seen many of the products these families use for styling their hair. I got the impression they are very much into the hair style product category, but qualitative observations can only go so far in terms of making generalizations about the population.  

To check my impressions I looked at data from the Experian Marketing Services Simmons National Hispanic Consumer Study that was collected in the twelve months ending on November 30, 2012, and confirmed that my impressions were on the right track.

As can be seen in the chart below, 43% of Latinos use hair styling products while only 34% of non-Hispanics use them.


Clearly, there are several reasons why this may be the case, including the fact that Latino adults have a median age that is about 10 years younger than the overall population. Also, we have discovered over the years that Latinos enjoy being well groomed in their everyday life. Further, their grooming customs come from their countries of origin where cultural patterns are strongly ingrained. Now, are all hair styling products equally used? As can be seen below there are products that are more heavily used than others.


Gel and mousse are by far the most popular hair styling products among Hispanics, and in general their use is in line with the overall population pattern of usage. Nevertheless, Latinos over-index quite dramatically in the both categories. But what brands are more popular? As can be seen in the chart below, consumers are quite divided among the different brands they use most often and the chart only includes the brands that have more than 1% usage among adult Hispanics. Still each for each of the top brands, Latinos exceed their non Latino counterparts. There are cases in which usage is triple among Hispanics, such as in the case of Alberto V05, and double such as in the case of Tresemme, or substantially higher like in the case of Suave.


The lesson I learn is that some of these brands may capitalize on making a serious effort to further their share among Hispanics. Particularly promising are brands with Latin American heritage and with names that are culturally compatible, like Tresemme, Alberto VO5, Suave, and Pantene.  In the age of social media, and knowing that Hispanics are particularly keen in the use of this technology, reaching out to Latinos with brand experiences that are appealing, informative, and seductive can render a large return on relatively modest investments.

Large media, like television, can also make a major difference with advertising  and branded entertainment. Ultimately any brand that makes a serious effort can find creative ways to connect culturally, for example, by attaching symbolic handles to their brands that Latinos can relate to.

The data used here is from Experian Marketing Services’ Simmons National Hispanic Consumer Study of adults 18+  and was collected from October 24, 2011 to November 30, 2012. The sample of Hispanics contains 8,521 individuals and the non-Hispanic sample has 17,043 people.

Tuesday, December 4, 2012

Language Preference for Television Watching by Latinos of Different Socioeconomic Levels

It has been of interest to me to explore how socioeconomic level relates to different consumer and media behaviors of Latinos in the United States. As media outlets become more abundant and as Latino growth shifts to births as opposed to sheer immigration, it is relevant to learn more about how to target Hispanics of different socioeconomic levels. In this particular instance, I am exploring the television watching behavior of Latinos according to their language of preference depending on their socioeconomic level.

Using data from the Experian Simmons National Hispanic Consumer Study that was collected in the twelve months ending on August 31, 2012, I created crosstabulations of the TGI Socio Economic Scale in the Simmons database by preference to watch television “Only in English,” “Mostly in English but Some in Spanish,” “Mostly in Spanish but Some in English,” and “Only in Spanish.” The television language preference variable in the analysis combined those who watch “Only in English” and “ Mostly in English but Some in Spanish” in one group, and those who watch in “Only in Spanish” and “Mostly in Spanish but Some in English” in another group.   Respondents stated their preference when reacting to the statement “When you watch television do you prefer to watch television programs...” The TGI Socio Economic Scale is a composite of education, ownership of selected household durables, mobile phone ownership, credit card ownership, usage of Internet and air travel. The scale results in four levels of socioeconomic standing: The top 10% of the population, the next 20% of the population, the next 30% of the population, and finally the remaining 40%.

The following line chart illustrates the trends uncovered:


As can be observed, the lowest socioeconomic level of Latinos is more likely than anyone else to prefer watching television in Spanish, although a substantive percentage of them also indicate preferring only English or mostly English television exposure. The percentages of Hispanics at this lowest level are more equally divided among language preferences than for any other socioeconomic level. Those in Level 3 are more polarized than the lowest level as their percentages are more divided between the two languages. The polarization increases at Levels 1 and 2 as they are more dramatically divided and in the large majority they prefer television exposure in the English language.

Overall, there is a tendency for those better educated and more affluent to prefer television in the English language and for those who are in the lower levels to be more oriented to the Spanish language. It is also likely that those in the higher socioeconomic levels are more acculturated into the US. The tendencies are almost linear and monotonic.


These trends point to the dynamics of the Latino market and its complexity.  While the preference to watch programming in the Spanish language continues to be important for a substantive portion of the Latino population, it is not a uniform tendency.  This is clearly due to the fact that with so many channels in English, Latinos simply find more offerings in English than in Spanish.  It is likely that the diversity of content in English drives some of these trends.  Those more affluent can be expected to have more choices of channels for the enjoyment of television programming and that may explain some of these preferences. Also, at the lower levels there are those who have been born in the United States that share their socioeconomic level with newer immigrants.  That makes for an interesting mix of acculturation stages that affect television language preferences.

Further, as Latinos become more able to appreciate content in English, their content horizons seem to expand. Socioeconomic status and bilingualism and English fluency are related.

Marketers can take from these findings important lessons and cautions:

1. Media planning is not straightforward.  Socioeconomic level plays a role and thus different types of products may do better on English language television platforms, and others on Spanish.

2. A mix of language television platforms may be appropriate for many advertising campaigns as television language preferences, particularly at Levels 3 and 4, are more divided. They represent 70% of the Latino population.

3. Language preference for television watching may not be indicative of assimilation but of content availability and content preferences.  Thus cultural insights should likely drive marketing and advertising campaigns.

This data confirms the diversity and complexity of the Latino market and the importance of sophisticated media planning efforts.

The data used here is from the Experian Simmons National Hispanic Consumer Study and was collected from August 1, 2011 to August 31, 2012. The sample contained 8120 Latinos.

Wednesday, October 31, 2012

Hispanic Attitudes and Behaviors by Socioeconomic level: Implications for Marketers

When talking about US Hispanics marketers seldom explore socioeconomic level as it relates to their attitudes and behaviors.  For me this is a most interesting relationship because if, for example, Latinos hold cultural attitudes in the same esteem regardless of their social standing, then one may conclude that one marketing approach may reach diverse types of Hispanics.
What should the marketer tell Hispanic consumers when selling a new Toyota Camry? Or what should the marketer tell Latinos when selling diapers? Should the communication and positioning approaches used be equally crafted to reach the Hispanic that can afford a new relatively expensive car, or a more common product like diapers?
Using data from the Experian Simmons National Hispanic Consumer Study that was collected in the twelve months ending on June 1, 2012, I created crosstabulations of the TGI Socio Economic Scale in the Experian Simmons database by those “agreeing a lot” with cultural attitudes and behaviors that will be specified below.  The TGI Socio Economic Scale is a composite of education, ownership of selected household durables, mobile phone ownership, credit card ownership, usage of Internet and air travel. The scale results in four levels of socio-economic standing: The top 10% of the population, the next 20% of the population, the next 30% of the population, and finally the remaining 40%.
The bar charts below report the percentage of Latinos in each of the Socio Economic Level that stated they “agree a lot” with each of the cultural statements.
The way to read these results is, for example:  Of those Latinos that are in the lowest 40% of the TGI Socio Economic scale, 30% “agree a lot” with “I often encourage Hispanic children to participate in traditional Hispanic games and activities,” and 25%  those in the next higher 30% level state they “agree a lot” with the statement.  Twenty percent in the next higher level and only about 16% in the highest Socio Economic level similarly “agree a lot.”   Meaning that strong agreement with the statement is heavily concentrated in the lower socioeconomic classes. There is a monotonic trend that indicates that as Socio Economic Level rises, attitudes and behaviors endorsing Latino cultural elements decrease. There are other attitudes and behaviors that do not conform with the above trend, for example:


The cultural value of being gregarious and enjoying family and extended family appears to be consistent across Socio Economic Levels, and to an even higher extent at the upper levels of the Socio Economic scale.  In general, however, the percentages are very high and they speak more readily about how certain cultural values persist even as people become wealthier and more educated. It appears, then, that some values and behaviors decline as Hispanics climb the social ladder and others persist regardless. This highlights the complexity of the Hispanic market. Further, those higher in the Socio Economic scale are more likely to endorse values of US society as reflected in the chart below regarding the priority of speaking English in the household.


The findings are consistent and surprising, in my opinion.  Those who are less affluent and less formally educated are the largest share of those indicating they engage in culturally related behaviors as well as holding attitudes and beliefs that are culturally based. Nevertheless there appear to be values that survive Latino prosperity like the value for family get togethers. It may be that those better off have more family around to get together with and that those less well off tend to be more geographically separated because of lack of economic resources.

These findings corroborate what our book “Hispanic Marketing: Connecting with the New Latino Consumer” says about how lower socioeconomic classes are more likely to be attached to their culture to a larger extent. It is also likely that having roots, of any kind, is more important to those who have not fared as well in society. Nevertheless, this data shows that there are exceptions and that more affluent Latinos are likely to endorse US values to a larger extent. That may not be too surprising but certainly the trend points to the importance of Socio Economic Level considerations in marketing to Hispanics.

Another factor to point out is that recency of immigration to the US should be correlated with Socio Economic Level. That may also explain to some extent why lower levels endorse cultural attitudes and behaviors to a larger extent.

The consistencies are important and we will report some more of these in future postings. The trends have powerful implications for those who for example plan business to business campaigns, or plan approaches geared to the more affluent. In a business to business setting, if targeting relatively well to do Hispanic business owners a culturally based approach may not be as relevant as when targeting Latino employees of that business.

Three trends were highlighted here. Specific cultural attitudes and behaviors that differentiate Latinos of diverse levels and that tend to be more strongly endorsed by those in the lower 40%; Other more general cultural attitudes and behaviors that seem to be relevant to all Hispanics; And, a tendency for the better off to endorse US values to a larger extent.

Marketers should, in my opinion, pay close attention to these findings. Marketing in culture may render more robust results when campaigns are directed to the lower socioeconomic strata. It appears that cultural heritage loses some prevalence as Latinos become increasingly affluent. Thus, having a campaign in Spanish with Latino themes for better off Hispanics may not be as productive as once thought.

The data used here is from the Experian Simmons National Hispanic Consumer Study and collected from April 25, 2011 to June 1, 2012. The sample contained 8252 Latinos.

Monday, October 8, 2012

Mobile Latinos

I was quite impressed when Max Kilger, Chief Behavioral Scientist for Experian Simmons, talked to my graduate Hispanic Marketing Communication class about new data findings regarding mobile technology use by Latinos.  I was particularly impressed because the sample that Experian Simmons uses yielded similar results to the ones I have been obtaining with the sample provided to Florida State University by Research Now. Cross-validation of results is reassuring.  Basically, Hispanics are eager users of mobile technology.

Here are some of the findings reported by Dr. Kilger to my class:

First, the percentage of use of mobile phones by Hispanics and non-Hispanics over a 7 day period is almost the same for Hispanic and non-Hispanics, with non-Hispanics having a 4 percentage point lead as seen in the chart below.  The Latino percentage of mobile use in one day, however, is about 4 percentage points higher.


Clearly, the small differences highlighted are interesting but almost trivial.  What matters here is that Hispanics are eager users of mobile phones, at least as much as the rest of the market combined. In prior blog postings I have presented data which shows that Hispanics, African Americans, and Asians use their mobile phones about double the amount of time as their non-Hispanic White counterparts. That suggests that when looking at all non-Hispanics combined it is likely that minorities are the ones responsible for much of the usage.

The next chart is more dramatic, not so much in terms of actual differences but in the fact that Latinos are eager to adopt new technologies and that when they adopt them they use them more. Here is the trend in terms of Tablet use.


While the penetration of tablets among Hispanics is not yet as high as among other cultural groups, Latinos who have them are more likely to use them. That comes as no surprise given the findings I have reported in the past couple of years. Technologies that allow for more fluid interpersonal communication and mobility have shown to be very attractive to Hispanics. My interpretation is that this is due to the eagerness that Latinos have to be connected. New technologies appear to be in fact “technologies of liberation” for Latinos.  Liberation in the sense that the constraints impeding interconnection among Hispanics are being removed by these electronic machines.


Another two charts that impressed me have to do with activities that Latinos engage in on their mobile phones.


Perhaps not surprisingly, Hispanics overindex in their use of text messaging, IM/Chat, and to a smaller degree in social networking.  My guess is that if these data were broken down further by cultural group we would see that minorities in general overindex in social networking as we have seen with our FSU data before.  That Latinos engage in mobile phone listening to music to a larger degree than anyone else confirms their attraction to music as part of their cultural existence.


It would be most interesting if the Experian Simmons data were broken down by different cultural groups so that comparisons could be made in more detail. Comparing culturally diverse groups among themselves can be illuminating for segmentation purposes.

My students and I were gratified to see that the Experian Simmons data supported the results we had found with the data from Research Now, and this confirmation lends credibility to the fact that Latinos are eager technology users who lead in many digital domains.

The data from which the above results are reported is from the Simmons Connect Study with a cross-platform sample of Hispanics of over 7,000 respondents.

Monday, September 17, 2012

Cultural Attitudes and Language Preference of Hispanics: Marketing Implications

Do attitudes towards Latino culture change depending on the language preference of Hispanics? This is a question that has importance to marketers and service providers.  If cultural attitudes differ for those who prefer to speak English and those who prefer to speak Spanish then one can conclude that language preference is also an indicator of how close one is to one’s own culture. If on the contrary, cultural attitudes do not differ or differ to a small extent between English and Spanish preferred Latinos, then one can conclude that the overall Latino culture persists regardless of current language preference.

Using data from the Simmons National Hispanic Consumer Study that was collected in the twelve months ending on March 16, 2012, I created crosstabulations of language preference by cultural attitudes among Hispanics. Language preference was gauged as the language the respondent prefers to speak in general and the response categories were Only English, Mostly English but Some Spanish, Mostly Spanish but Some English, and Only Spanish. For this analysis I collapsed Only and Mostly English and Only and Mostly Spanish to form the preferences for English or Spanish.

Cultural attitudes were measured with a Likert type scale “Agree a lot,” Agree a little,” “Neither agree nor disagree,” “Disagree a little,” and Disagree a Lot.”  The items to agree or disagree with were:  

  • I believe it is important to teach Spanish to Hispanic Children as a way to help preserve Hispanic culture
  • I have more Hispanic friends than non-Hispanic friends
  • I make an effort to have my personal appearance reflect that I am Hispanic/Latino
  • Speaking English in our home is a priority in our Household
  • Speaking Spanish in our home is a priority in our Household

The two agree response categories in the scale were added up to have an overall agreement percentage.  The following chart shows the average percentages for those who prefer to speak English and those who prefer to speak Spanish for each of the attitudes.


The reader can see that generally speaking those who prefer to communicate in English exhibit a lesser priority in endorsing items that reflect a cultural attachment.  In particular, and in a somewhat obvious way, those who prefer to speak in English express that Speaking English at home is more of a priority for them than for their Spanish preferred counterparts. That trend is strongly reversed for those who prefer to speak Spanish as they indicate a very strong priority for Spanish to be the language of the home.

What is counterintuitive and revealing is that a large majority of those who prefer to speak English indicate that teaching Spanish to Children is a way to help preserve Hispanic culture. To me that means that preferring to speak English does not necessarily mean that the Spanish language is not highly thought of.

That those that prefer Spanish have more Hispanic friends than those who prefer English is not surprising.  The social networks of those who prefer English are likely to be wider and more diversified. Those who prefer Spanish are likely to live and work in conditions that may be somewhat  more segregated.

While a Latino personal appearance is not highly important in general, those who prefer Spanish endorse it to a larger extent.  And that is not very surprising either, because as one’s circles and circumstances expand one is more likely to also acquire the styles of those varied groups.

The main lesson for marketing, from my point of view is that while language preference does differentiate Latinos’ cultural attitudes, positive attitudes towards cultural elements persist among those who prefer to speak English.  In particular this is true when it comes to the education of children. It is an ambition to have one’s kids learn Spanish as a proxy for preserving the culture.

The moral of the story is that while Hispanics may be acculturating and switching to English as they stay longer in the United States, their loyalty to their heritage appears to persist.  Thus, cultural messages are likely to be a key link to reaching out to Hispanics be they Spanish or English preferred.

The data used here is from the Simmons National Hispanic Consumer Study and collected from January 31, 2011 to March 16, 2012. The sample contained 3,518 English preferred Latinos, and 2,104 Spanish preferred Hispanics.

Wednesday, September 5, 2012

Language Preference of Hispanics and Perceptions of Financial Well Being: Implications for Marketing

To what extent has the financial situation affected the perceptions of financial well-being of Latinos depending on their language preference? This question has implications because the answer may impact the way in which consumers make purchase decisions.

Language preference among Hispanics has been considered a proxy for acculturation. It is also an indicator of the many aspects of life that impact Hispanics from media preferences to interpersonal interactions. The anti-immigration sentiment prevalent in many circles in the US these days has hurt recent immigrants in particular. In addition, economic circumstances in the past few years are likely to have affected Latinos differentially depending on their integration in the US.

Using data from the Simmons National Hispanic Consumer Study that was collected in the twelve months ended on March 16, 2012, I created crosstabulations of language preference by financial outlook among Hispanics. Language preference was gauged as the language the respondent prefers to speak in general and the response categories were Only English, Mostly English but Some Spanish, Mostly Spanish but Some English, and Only Spanish. For this analysis I collapsed Only and Mostly English and Only and Mostly Spanish to form the preferences for English or Spanish.

The financial outlook dimension was measured with the question: Do you think you are better off or worse off financially now than you were 12 months ago? The response categories were Significantly Worse Off, Somewhat Worse Off, About the Same, Somewhat Better Off, and Significantly Better Off. For the purposes of this analysis I collapsed those who answered significantly and somewhat worse off, and those who answered significantly and somewhat better off to result in three categories: Better Off, About the Same, and Worse Off.

The resulting “average” table is presented below:


The plurality, over 30% of Latinos indicate that their financial situation is about the same as it was 12 months ago. This can mean different things.  It can mean that things have not improved or that things have been as good as they were a year ago. Given the economic situation the US is going through, most likely it means that things have not improved but not gotten worse. Also, the “fatalism” prevalent in the culture may lead many to express that things are the same as usual and that in the average there is no change.

English preferred Hispanics, however, have a much more positive perspective than Spanish preferred Latinos as a substantively larger percentage of them indicate they are better off now than 12 months ago than their Spanish preferred counterparts. This may not be completely surprising since Spanish preferred respondents are more likely to be more recent immigrants and also more likely to suffer the consequences of immigration policies. These more recent immigrants are also more likely to have suffered from lack of work due to the lack of jobs in industries like construction that have traditionally employed many recent immigrants from Mexico and other parts of Latin America.

In a somewhat contradictory fashion, a few more English preferred Hispanics also report being worse off now than Spanish preferred respondents, but the differences between these two groups are very small. What is interesting is that over 25% of Latinos feel things have been worse for them in general. While not surprising, these figures bring home the notion that the economy and immigration related issues are likely to have made life worse for many Hispanics who try hard to make a living for themselves and their families.

The news for marketers are mixed.  The majority of Hispanics feel they are better off or about the same as they were 12 months ago, and that is good news as that means that spending by most Latinos is likely to continue at a sustained pace. The negative news are that a substantial percentage feel the brunt of pervasive immigration and economic conditions and that their spending may be limited by their actual and perceived spending power. This brings about the importance of making politicians aware that the uncertainty of immigration reform needs to be removed for economic growth. The clarification of immigration policies and rules is likely to make the future more predictable and optimistic for many. Also, as in the overall economy, job creation should be a most important priority.

The data used here is from the Simmons National Hispanic Consumer Study and collected from January 31, 2011 to March 16, 2012. The sample contained 3,518 English preferred Latinos, and 2,104 Spanish preferred Hispanics.