Pages

Tuesday, December 4, 2012

Language Preference for Television Watching by Latinos of Different Socioeconomic Levels

It has been of interest to me to explore how socioeconomic level relates to different consumer and media behaviors of Latinos in the United States. As media outlets become more abundant and as Latino growth shifts to births as opposed to sheer immigration, it is relevant to learn more about how to target Hispanics of different socioeconomic levels. In this particular instance, I am exploring the television watching behavior of Latinos according to their language of preference depending on their socioeconomic level.

Using data from the Experian Simmons National Hispanic Consumer Study that was collected in the twelve months ending on August 31, 2012, I created crosstabulations of the TGI Socio Economic Scale in the Simmons database by preference to watch television “Only in English,” “Mostly in English but Some in Spanish,” “Mostly in Spanish but Some in English,” and “Only in Spanish.” The television language preference variable in the analysis combined those who watch “Only in English” and “ Mostly in English but Some in Spanish” in one group, and those who watch in “Only in Spanish” and “Mostly in Spanish but Some in English” in another group.   Respondents stated their preference when reacting to the statement “When you watch television do you prefer to watch television programs...” The TGI Socio Economic Scale is a composite of education, ownership of selected household durables, mobile phone ownership, credit card ownership, usage of Internet and air travel. The scale results in four levels of socioeconomic standing: The top 10% of the population, the next 20% of the population, the next 30% of the population, and finally the remaining 40%.

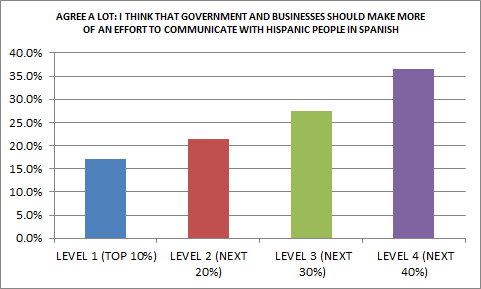
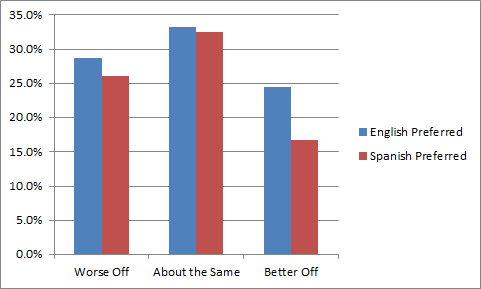
The following line chart illustrates the trends uncovered:


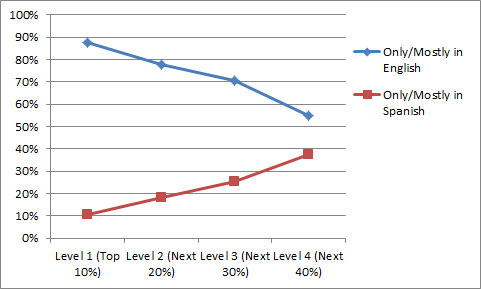
As can be observed, the lowest socioeconomic level of Latinos is more likely than anyone else to prefer watching television in Spanish, although a substantive percentage of them also indicate preferring only English or mostly English television exposure. The percentages of Hispanics at this lowest level are more equally divided among language preferences than for any other socioeconomic level. Those in Level 3 are more polarized than the lowest level as their percentages are more divided between the two languages. The polarization increases at Levels 1 and 2 as they are more dramatically divided and in the large majority they prefer television exposure in the English language.

Overall, there is a tendency for those better educated and more affluent to prefer television in the English language and for those who are in the lower levels to be more oriented to the Spanish language. It is also likely that those in the higher socioeconomic levels are more acculturated into the US. The tendencies are almost linear and monotonic.


These trends point to the dynamics of the Latino market and its complexity.  While the preference to watch programming in the Spanish language continues to be important for a substantive portion of the Latino population, it is not a uniform tendency.  This is clearly due to the fact that with so many channels in English, Latinos simply find more offerings in English than in Spanish.  It is likely that the diversity of content in English drives some of these trends.  Those more affluent can be expected to have more choices of channels for the enjoyment of television programming and that may explain some of these preferences. Also, at the lower levels there are those who have been born in the United States that share their socioeconomic level with newer immigrants.  That makes for an interesting mix of acculturation stages that affect television language preferences.

Further, as Latinos become more able to appreciate content in English, their content horizons seem to expand. Socioeconomic status and bilingualism and English fluency are related.

Marketers can take from these findings important lessons and cautions:

1. Media planning is not straightforward.  Socioeconomic level plays a role and thus different types of products may do better on English language television platforms, and others on Spanish.

2. A mix of language television platforms may be appropriate for many advertising campaigns as television language preferences, particularly at Levels 3 and 4, are more divided. They represent 70% of the Latino population.

3. Language preference for television watching may not be indicative of assimilation but of content availability and content preferences.  Thus cultural insights should likely drive marketing and advertising campaigns.

This data confirms the diversity and complexity of the Latino market and the importance of sophisticated media planning efforts.

The data used here is from the Experian Simmons National Hispanic Consumer Study and was collected from August 1, 2011 to August 31, 2012. The sample contained 8120 Latinos.

Wednesday, November 14, 2012

Multicultural Technology Leadership: Tablets and Blogs

Over the past several years we have measured technology use and adoption at the Center for Hispanic Marketing Communication at Florida State University. We have consistently found that emerging minorities tend to lead in most areas of technology adoption. In 2012 with the cooperation of Research Now and the leadership of Ms. Melanie Courtright, we again collected an online national sample composed of Hispanics and Asians born in the US and those born abroad, in addition to African Americans and Non-Hispanic Whites. We used the country of birth as a proxy for acculturation to see if technology adoption varied accordingly.

Tablets are creating chaos in the computer industry because consumers are adopting them and discarding laptops, desktops, and netbooks. The following chart shows how adoption of tablets varies of by cultural group and by place of birth.


As can be seen, Asians born abroad exhibit the largest penetration of tablet current ownership and also their projected ownership in the next year. Their affluence and technological savvy may account for this trend. Hispanics not born in the US are the second group in their ownership of tablets, and their minority counterparts follow them closely. Non-Hispanic Whites, however, lag substantially. This speaks of the technology eagerness of minorities and their leadership in technology adoption.  The differences, however, appear to vanish when looking at aspirations for the next year. Thus, minorities innovate but tablets are becoming very desirable overall.

Having a blog should be a good indicator of innovativeness in web communications. The following chart illustrates the penetration of blog ownership in different cultural groups.


Current blog ownership is highest among Asians, followed by Hispanics. African Americans and Non-Hispanic Whites lag. Tendencies for the next year vary and highlight that those not born in the US are more interested in having a blog, both Latinos and Asians. African Americans also show the aspiration to have a blog in a year in sharp contrast to their current blog ownership. Non-Hispanic Whites seem less eager to have a blog now and in the future, and interestingly Asians born in the US are at the same level as Non-Hispanic Whites in their future blog ownership.

Overall, these trends are puzzling and definitely should ignite the imagination of technology marketers. The relative popularity of blogs and their future growth indicate the social eagerness of minority groups. Culturally, blogs provide an outlet for creativity, expression, and a voice that minorities did not have before.  Marketers can take advantage of this eagerness by using these growing blogs as advertising venues for reaching out to minority networks, for example.

The phenomenal adoption of tablets and their appeal for the near future are more striking.  Mobile advertising will become increasingly powerful and tablets will be the new platform for communication. That minorities are leading now should give food for thought to marketers that are trying to predict future trends and understand where their brands will be in the near future.

The data for this study was collected by Research Now of Dallas, Texas, thanks to the generous initiative of Ms. Melanie Courtright. Research Now contributed these data to the research efforts of the Center for Hispanic Marketing Communication at Florida State University. This online survey included the responses of 936 Asians (398 US born), 458 African Americans, 833 Hispanics (624 US born), and 456 non Hispanic Whites. This national sample had quotas for US region, age, and gender to increase representativeness.

Wednesday, October 31, 2012

Hispanic Attitudes and Behaviors by Socioeconomic level: Implications for Marketers

When talking about US Hispanics marketers seldom explore socioeconomic level as it relates to their attitudes and behaviors.  For me this is a most interesting relationship because if, for example, Latinos hold cultural attitudes in the same esteem regardless of their social standing, then one may conclude that one marketing approach may reach diverse types of Hispanics.
What should the marketer tell Hispanic consumers when selling a new Toyota Camry? Or what should the marketer tell Latinos when selling diapers? Should the communication and positioning approaches used be equally crafted to reach the Hispanic that can afford a new relatively expensive car, or a more common product like diapers?
Using data from the Experian Simmons National Hispanic Consumer Study that was collected in the twelve months ending on June 1, 2012, I created crosstabulations of the TGI Socio Economic Scale in the Experian Simmons database by those “agreeing a lot” with cultural attitudes and behaviors that will be specified below.  The TGI Socio Economic Scale is a composite of education, ownership of selected household durables, mobile phone ownership, credit card ownership, usage of Internet and air travel. The scale results in four levels of socio-economic standing: The top 10% of the population, the next 20% of the population, the next 30% of the population, and finally the remaining 40%.
The bar charts below report the percentage of Latinos in each of the Socio Economic Level that stated they “agree a lot” with each of the cultural statements.
The way to read these results is, for example:  Of those Latinos that are in the lowest 40% of the TGI Socio Economic scale, 30% “agree a lot” with “I often encourage Hispanic children to participate in traditional Hispanic games and activities,” and 25%  those in the next higher 30% level state they “agree a lot” with the statement.  Twenty percent in the next higher level and only about 16% in the highest Socio Economic level similarly “agree a lot.”   Meaning that strong agreement with the statement is heavily concentrated in the lower socioeconomic classes. There is a monotonic trend that indicates that as Socio Economic Level rises, attitudes and behaviors endorsing Latino cultural elements decrease. There are other attitudes and behaviors that do not conform with the above trend, for example:


The cultural value of being gregarious and enjoying family and extended family appears to be consistent across Socio Economic Levels, and to an even higher extent at the upper levels of the Socio Economic scale.  In general, however, the percentages are very high and they speak more readily about how certain cultural values persist even as people become wealthier and more educated. It appears, then, that some values and behaviors decline as Hispanics climb the social ladder and others persist regardless. This highlights the complexity of the Hispanic market. Further, those higher in the Socio Economic scale are more likely to endorse values of US society as reflected in the chart below regarding the priority of speaking English in the household.


The findings are consistent and surprising, in my opinion.  Those who are less affluent and less formally educated are the largest share of those indicating they engage in culturally related behaviors as well as holding attitudes and beliefs that are culturally based. Nevertheless there appear to be values that survive Latino prosperity like the value for family get togethers. It may be that those better off have more family around to get together with and that those less well off tend to be more geographically separated because of lack of economic resources.

These findings corroborate what our book “Hispanic Marketing: Connecting with the New Latino Consumer” says about how lower socioeconomic classes are more likely to be attached to their culture to a larger extent. It is also likely that having roots, of any kind, is more important to those who have not fared as well in society. Nevertheless, this data shows that there are exceptions and that more affluent Latinos are likely to endorse US values to a larger extent. That may not be too surprising but certainly the trend points to the importance of Socio Economic Level considerations in marketing to Hispanics.

Another factor to point out is that recency of immigration to the US should be correlated with Socio Economic Level. That may also explain to some extent why lower levels endorse cultural attitudes and behaviors to a larger extent.

The consistencies are important and we will report some more of these in future postings. The trends have powerful implications for those who for example plan business to business campaigns, or plan approaches geared to the more affluent. In a business to business setting, if targeting relatively well to do Hispanic business owners a culturally based approach may not be as relevant as when targeting Latino employees of that business.

Three trends were highlighted here. Specific cultural attitudes and behaviors that differentiate Latinos of diverse levels and that tend to be more strongly endorsed by those in the lower 40%; Other more general cultural attitudes and behaviors that seem to be relevant to all Hispanics; And, a tendency for the better off to endorse US values to a larger extent.

Marketers should, in my opinion, pay close attention to these findings. Marketing in culture may render more robust results when campaigns are directed to the lower socioeconomic strata. It appears that cultural heritage loses some prevalence as Latinos become increasingly affluent. Thus, having a campaign in Spanish with Latino themes for better off Hispanics may not be as productive as once thought.

The data used here is from the Experian Simmons National Hispanic Consumer Study and collected from April 25, 2011 to June 1, 2012. The sample contained 8252 Latinos.

Monday, October 8, 2012

Mobile Latinos

I was quite impressed when Max Kilger, Chief Behavioral Scientist for Experian Simmons, talked to my graduate Hispanic Marketing Communication class about new data findings regarding mobile technology use by Latinos.  I was particularly impressed because the sample that Experian Simmons uses yielded similar results to the ones I have been obtaining with the sample provided to Florida State University by Research Now. Cross-validation of results is reassuring.  Basically, Hispanics are eager users of mobile technology.

Here are some of the findings reported by Dr. Kilger to my class:

First, the percentage of use of mobile phones by Hispanics and non-Hispanics over a 7 day period is almost the same for Hispanic and non-Hispanics, with non-Hispanics having a 4 percentage point lead as seen in the chart below.  The Latino percentage of mobile use in one day, however, is about 4 percentage points higher.


Clearly, the small differences highlighted are interesting but almost trivial.  What matters here is that Hispanics are eager users of mobile phones, at least as much as the rest of the market combined. In prior blog postings I have presented data which shows that Hispanics, African Americans, and Asians use their mobile phones about double the amount of time as their non-Hispanic White counterparts. That suggests that when looking at all non-Hispanics combined it is likely that minorities are the ones responsible for much of the usage.

The next chart is more dramatic, not so much in terms of actual differences but in the fact that Latinos are eager to adopt new technologies and that when they adopt them they use them more. Here is the trend in terms of Tablet use.


While the penetration of tablets among Hispanics is not yet as high as among other cultural groups, Latinos who have them are more likely to use them. That comes as no surprise given the findings I have reported in the past couple of years. Technologies that allow for more fluid interpersonal communication and mobility have shown to be very attractive to Hispanics. My interpretation is that this is due to the eagerness that Latinos have to be connected. New technologies appear to be in fact “technologies of liberation” for Latinos.  Liberation in the sense that the constraints impeding interconnection among Hispanics are being removed by these electronic machines.


Another two charts that impressed me have to do with activities that Latinos engage in on their mobile phones.


Perhaps not surprisingly, Hispanics overindex in their use of text messaging, IM/Chat, and to a smaller degree in social networking.  My guess is that if these data were broken down further by cultural group we would see that minorities in general overindex in social networking as we have seen with our FSU data before.  That Latinos engage in mobile phone listening to music to a larger degree than anyone else confirms their attraction to music as part of their cultural existence.


It would be most interesting if the Experian Simmons data were broken down by different cultural groups so that comparisons could be made in more detail. Comparing culturally diverse groups among themselves can be illuminating for segmentation purposes.

My students and I were gratified to see that the Experian Simmons data supported the results we had found with the data from Research Now, and this confirmation lends credibility to the fact that Latinos are eager technology users who lead in many digital domains.

The data from which the above results are reported is from the Simmons Connect Study with a cross-platform sample of Hispanics of over 7,000 respondents.

Monday, September 17, 2012

Cultural Attitudes and Language Preference of Hispanics: Marketing Implications

Do attitudes towards Latino culture change depending on the language preference of Hispanics? This is a question that has importance to marketers and service providers.  If cultural attitudes differ for those who prefer to speak English and those who prefer to speak Spanish then one can conclude that language preference is also an indicator of how close one is to one’s own culture. If on the contrary, cultural attitudes do not differ or differ to a small extent between English and Spanish preferred Latinos, then one can conclude that the overall Latino culture persists regardless of current language preference.

Using data from the Simmons National Hispanic Consumer Study that was collected in the twelve months ending on March 16, 2012, I created crosstabulations of language preference by cultural attitudes among Hispanics. Language preference was gauged as the language the respondent prefers to speak in general and the response categories were Only English, Mostly English but Some Spanish, Mostly Spanish but Some English, and Only Spanish. For this analysis I collapsed Only and Mostly English and Only and Mostly Spanish to form the preferences for English or Spanish.

Cultural attitudes were measured with a Likert type scale “Agree a lot,” Agree a little,” “Neither agree nor disagree,” “Disagree a little,” and Disagree a Lot.”  The items to agree or disagree with were:  

  • I believe it is important to teach Spanish to Hispanic Children as a way to help preserve Hispanic culture
  • I have more Hispanic friends than non-Hispanic friends
  • I make an effort to have my personal appearance reflect that I am Hispanic/Latino
  • Speaking English in our home is a priority in our Household
  • Speaking Spanish in our home is a priority in our Household

The two agree response categories in the scale were added up to have an overall agreement percentage.  The following chart shows the average percentages for those who prefer to speak English and those who prefer to speak Spanish for each of the attitudes.


The reader can see that generally speaking those who prefer to communicate in English exhibit a lesser priority in endorsing items that reflect a cultural attachment.  In particular, and in a somewhat obvious way, those who prefer to speak in English express that Speaking English at home is more of a priority for them than for their Spanish preferred counterparts. That trend is strongly reversed for those who prefer to speak Spanish as they indicate a very strong priority for Spanish to be the language of the home.

What is counterintuitive and revealing is that a large majority of those who prefer to speak English indicate that teaching Spanish to Children is a way to help preserve Hispanic culture. To me that means that preferring to speak English does not necessarily mean that the Spanish language is not highly thought of.

That those that prefer Spanish have more Hispanic friends than those who prefer English is not surprising.  The social networks of those who prefer English are likely to be wider and more diversified. Those who prefer Spanish are likely to live and work in conditions that may be somewhat  more segregated.

While a Latino personal appearance is not highly important in general, those who prefer Spanish endorse it to a larger extent.  And that is not very surprising either, because as one’s circles and circumstances expand one is more likely to also acquire the styles of those varied groups.

The main lesson for marketing, from my point of view is that while language preference does differentiate Latinos’ cultural attitudes, positive attitudes towards cultural elements persist among those who prefer to speak English.  In particular this is true when it comes to the education of children. It is an ambition to have one’s kids learn Spanish as a proxy for preserving the culture.

The moral of the story is that while Hispanics may be acculturating and switching to English as they stay longer in the United States, their loyalty to their heritage appears to persist.  Thus, cultural messages are likely to be a key link to reaching out to Hispanics be they Spanish or English preferred.

The data used here is from the Simmons National Hispanic Consumer Study and collected from January 31, 2011 to March 16, 2012. The sample contained 3,518 English preferred Latinos, and 2,104 Spanish preferred Hispanics.

Friday, September 7, 2012

Political Affiliation and Attitudes of Hispanics

In this heated political season of the Fall of 2012, when the different political parties are trying to get the attention of Hispanics it is of interest to explore how the political affiliation of Hispanics relates to some of their attitudes.

With online data collected by Research Now of Dallas Texas, for the Center for Hispanic Marketing Communication at Florida State University, I explore here a variety of attitudes as they relate to the political affiliation of Hispanic respondents. Affiliation was measured by asking respondents “Could you please tell us your political affiliation?” and the answer categories were Republican, Democrat, Independent, and No Party Affiliation, as well as the opportunity to refuse to answer. The attitude items were statements to which respondents could answer any number from 5 to 0, where 5 meant “Completely Agree” and 0 meant “Completely Disagree.”

Independent respondents were more likely to state  the economic crisis has made them more frugal in their purchases than other respondents. They were followed by those with no party affiliation. Republicans and Democrats were somewhat less likely to agree with the statement.


Still, in the context of a scale from 0 to 5, there was a general sense that frugality has been a factor in these consumers’ lives.  Perhaps Independent respondents and those with no party affiliation have opted for those responses because they are politically dissatisfied.

Interestingly, when asked about worrying about retirement, the trend is somewhat different.


In the case of worrying about retirement, Republicans and Democrats seem to be more worried than their counterparts. Again, in the context of the scale we used, this is a concern to many Latinos, in general.  

The use of coupons can be construed as an indicator of economic concern.


Here the reader can see a monotonic decline of habitual use of coupons with political affiliation, from Republican to No party affiliation.  Is it the case that those with a party affiliation are somewhat more systematic in organizing their purchases?

These days it is common for companies to endorse the idea that they need to give back to the communities they benefit from. 


Democrats and Independents are more likely to agree that they favor the companies that give back to the community. This is perhaps associated with socioeconomic status and with a more socially oriented philosophy.

Voting along the lines of political affiliation is obviously more prevalent among Democrats and Republicans. This is perhaps not surprising but the trend confirms that there is a sense of loyalty to the party.


There are many politicians and advertising strategists who believe that to influence Hispanics they need to use Latinos models and that influence is likely to come from other Latinos.


While there are some small differences among affiliations regarding the feeling that one is more influenced politically by others of one’s own ethnic group, the overall level of agreement is very low. This means to me that the influence regarding Latino political behavior is more based on issues and party affiliation than on the ethnicity of influencers.

Similarly, regarding advertising, we find that while there are some differences regarding the influence of others who share a Latino ethnicity, overall the ethnicity of the people featured in the ads does not seem to be highly important.


This may be due to the fact that Latinos come in all colors and that the party affiliation and issues are more important than the ethnicity of the characters in ads. Republicans are particularly less likely to be influenced by the ethnicity of the advertising portrayals.

Overall one can conclude that political affiliation does seem to have a relationship with attitudes about the economy, even though everyone seems to be affected by economic conditions  in general. Further, political affiliation seems to be a matter of loyalty particularly for Republicans and Democrats. The ethnicity of influencers, however, does not seem to be that important to these online consumers.

The data for this study was collected by Research Now of Dallas, Texas, thanks to the generous initiative of Ms. Melanie Courtright. Research Now contributed these data to the research efforts of the Center for Hispanic Marketing Communication at Florida State University.  This national sample had quotas for US region, age, and gender to increase representativeness. The distribution of political affiliations was as follows:


Wednesday, September 5, 2012

Language Preference of Hispanics and Perceptions of Financial Well Being: Implications for Marketing

To what extent has the financial situation affected the perceptions of financial well-being of Latinos depending on their language preference? This question has implications because the answer may impact the way in which consumers make purchase decisions.

Language preference among Hispanics has been considered a proxy for acculturation. It is also an indicator of the many aspects of life that impact Hispanics from media preferences to interpersonal interactions. The anti-immigration sentiment prevalent in many circles in the US these days has hurt recent immigrants in particular. In addition, economic circumstances in the past few years are likely to have affected Latinos differentially depending on their integration in the US.

Using data from the Simmons National Hispanic Consumer Study that was collected in the twelve months ended on March 16, 2012, I created crosstabulations of language preference by financial outlook among Hispanics. Language preference was gauged as the language the respondent prefers to speak in general and the response categories were Only English, Mostly English but Some Spanish, Mostly Spanish but Some English, and Only Spanish. For this analysis I collapsed Only and Mostly English and Only and Mostly Spanish to form the preferences for English or Spanish.

The financial outlook dimension was measured with the question: Do you think you are better off or worse off financially now than you were 12 months ago? The response categories were Significantly Worse Off, Somewhat Worse Off, About the Same, Somewhat Better Off, and Significantly Better Off. For the purposes of this analysis I collapsed those who answered significantly and somewhat worse off, and those who answered significantly and somewhat better off to result in three categories: Better Off, About the Same, and Worse Off.

The resulting “average” table is presented below:


The plurality, over 30% of Latinos indicate that their financial situation is about the same as it was 12 months ago. This can mean different things.  It can mean that things have not improved or that things have been as good as they were a year ago. Given the economic situation the US is going through, most likely it means that things have not improved but not gotten worse. Also, the “fatalism” prevalent in the culture may lead many to express that things are the same as usual and that in the average there is no change.

English preferred Hispanics, however, have a much more positive perspective than Spanish preferred Latinos as a substantively larger percentage of them indicate they are better off now than 12 months ago than their Spanish preferred counterparts. This may not be completely surprising since Spanish preferred respondents are more likely to be more recent immigrants and also more likely to suffer the consequences of immigration policies. These more recent immigrants are also more likely to have suffered from lack of work due to the lack of jobs in industries like construction that have traditionally employed many recent immigrants from Mexico and other parts of Latin America.

In a somewhat contradictory fashion, a few more English preferred Hispanics also report being worse off now than Spanish preferred respondents, but the differences between these two groups are very small. What is interesting is that over 25% of Latinos feel things have been worse for them in general. While not surprising, these figures bring home the notion that the economy and immigration related issues are likely to have made life worse for many Hispanics who try hard to make a living for themselves and their families.

The news for marketers are mixed.  The majority of Hispanics feel they are better off or about the same as they were 12 months ago, and that is good news as that means that spending by most Latinos is likely to continue at a sustained pace. The negative news are that a substantial percentage feel the brunt of pervasive immigration and economic conditions and that their spending may be limited by their actual and perceived spending power. This brings about the importance of making politicians aware that the uncertainty of immigration reform needs to be removed for economic growth. The clarification of immigration policies and rules is likely to make the future more predictable and optimistic for many. Also, as in the overall economy, job creation should be a most important priority.

The data used here is from the Simmons National Hispanic Consumer Study and collected from January 31, 2011 to March 16, 2012. The sample contained 3,518 English preferred Latinos, and 2,104 Spanish preferred Hispanics.

Thursday, August 23, 2012

Multicultural Video Consumption by Mode of Delivery


How is the amount of time spent watching video divided among streaming, DVD’s, and broadcast/satellite/cable among the different cultural groups in the US?  Here we present some of the data collected by Research Now for the Florida State University Multicultural Marketing study of 2012 that answers that question.

We asked our online sample of respondents to tell us “in an average week, approximately how many hours do you spend...?” for multiple activities. The respondents were divided into those born in the US and those born abroad because that could have an impact on the language they select for their video exposure.

Below is the chart detailing the number of weekly hours spent watching streamed videos by different cultural groups. As can be seen streaming is most popular among Hispanics and Asians not born in the US and least among non-Hispanic Whites. Asians not born in the US report more than five hours per week watching these videos, followed by Latinos not born in the US with almost five hours per week. It may be that these groups, because of their bilingualism add more content to their routines.


As seen in the chart below, watching rented DVD’s presents a similar pattern, but the number of hours allocated to this video delivery mode is lower and Hispanics born abroad have the highest tendency to rent DVD’s. In general, Hispanics and Asians are generally more likely to rent DVD’s than anyone else.  Perhaps the heritage of countries of origin and the availability of certain types of content account for these differences.

Watching TV via broadcast, cable, and satellite is still the dominant mode of video consumption as can be seen below.  

It is interesting to note, however, that those more likely to stream and rent are those less likely to watch TV in more traditional ways.  Asians and Hispanics are less likely to watch broadcast than their African American and non-Hispanic White counterparts.

These results imply that changes in video watching routines vary by cultural group and by place of birth, with the obvious implication for language preferences. Video providers like Netflix and Hulu that favor streaming are likely to be more attractive to Hispanics and Asians, particularly those born abroad. Traditional video providers like Comcast, Dish Network, and broadcast may do well in anticipating the transition that is taking place by putting more of their content online, in particular if they wish to survive in a much more competitive environment. In this new environment emerging culturally diverse groups appear to be taking the lead in enjoying newer modes of delivery.  

Cable and satellite companies may not only want to make their content available online but also they may want to reconsider how subscribers buy their content. The greater ability to choose provided by streaming and the fading DVD’s mode is not as available in cable and satellite since these companies require the purchases of large bundles of programming.

All in all, the competitive world of online video delivery seems to be hot and worthy of much attention.

The data for this study was collected by Research Now of Dallas, Texas, thanks to the generous initiative of Ms. Melanie Courtright. Research Now contributed these data to the research efforts of the Center for Hispanic Marketing Communication at Florida State University. The distribution of the sample is as follows:
This national online sample had quotas for US region, age, and gender to increase representativeness.

Monday, August 6, 2012

Hispanic Affluence by State - Implications for Marketing

The American Community Survey (ACS) of the US Census Bureau provides important insights into the lives of Americans. Friends of mine frequently ask me about the level of affluence among US Hispanics. Those households with incomes of $75,000 or higher are generally considered to be affluent. What states have higher percentages of affluent Latinos?  How do Latinos compare with the overall population in terms of affluence across States?

In order to try to answer these questions I obtained 5 year estimates from the ACS (2006 - 2010) for household income and compared Hispanics with the overall population by State, then created an index of Latinos as a percentage of the overall population in terms of household income. The latter index I thought would help us visualize which States have a larger gap as compared with others.

The following Table contains the States, including the District of Columbia and Puerto Rico, with the lowest disparities in terms of the percentages of Latino households with incomes of $75K+, compared with the corresponding percentages for the overall population for each State.  The last column represents an index of disparity.  The larger the index the better, comparatively, Hispanics do in that State.  The index was created by dividing the Latino percentage over the overall percentage of those with household incomes of $75K +.


The above table shows that the States with lower disparities of percentages of households with incomes of $75K per year or more are either those that have generally lower incomes, or those that have unusual economies with higher incomes overall such as Alaska, and Hawaii. Regardless of overall economic trends in these States, it is interesting to observe that Hispanics are generally doing quite well across the board as the proportion of affluent Latinos suggests that generally about 25% of their households earn significant incomes.

The table below shows the States with the largest disparities.


The States with the largest disparities between Latinos and the overall population show a trend similar to that in the above table. In States with higher proportions of high earner households overall, Latinos tend to do proportionally less well, for example California, Arizona, Delaware, Texas and Utah. At this lower end of the disparity distribution, however, even those States that have lower proportions of affluent households also show a sharp contrast when compared with their Hispanic household component. These States are exemplified by Alabama, South Carolina, Tennessee, Montana, Kansas, Arkansas, Oklahoma, and Idaho.

The big lesson is that generally speaking Hispanics seems to be doing quite well in terms of having a relatively high representation of high earning households overall.  There are gaps that are due to economic conditions and opportunities but for marketers, the lesson is clear. High earning Latino households are abundant and their significant presence points to their potential for enhancing the bottom line of many marketers that realize their potential. Be these opportunities cars, homes, recreational vehicles, vacations, travel, education, restaurants, etc. savvy marketers can start taking action when they see that they may not be culturally addressing an important part of the potential customer base.

Friday, July 27, 2012

Online Expenditures in the Multicultural Marketplace

How much money do members of different cultural groups spend online in an average month? What percentage of their purchases does that represent? These are two of the questions addressed with culturally diverse consumers in the 2012 multicultural marketing study of the Center for Hispanic Marketing Communication of Florida State University in cooperation with Research Now.

Monthly expenditures online differ in a somewhat predictable and interesting way as can be seen in the chart below.


Asians in the US indicate they spend about $125 dollars making purchases online and this mean is statistically different from that of all other groups. There was not a statistically significant difference among Non Hispanic Whites, African Americans and Hispanics. The affluence of US Asians and their proclivity for online shopping may account for this difference. Still the amount of money of the three other cultural groups is substantive as well.

Interestingly, the proportion of purchases reported did not differ statistically among most groups as seen in the chart below, except that non Hispanic Whites reported a somewhat lower proportion of monthly online purchases than the other three groups..


The overall trends are notable because many marketers have not realized that once online consumers of all groups tend to spend about the same amount on online purchases. Thus, online marketing should be directed to each of these groups emphasizing the unique cultural relevance of the product or service.  Basically, once online there does not seem to be a dominant group to whom messages need to be directed.  In the average, all these consumers are spending similar amounts. Notably, Asians tend to stand out as online shoppers because of their affluence, and non Hispanic Whites by being somewhat less eager to purchase online. This latter finding is counterintuitive because the expectation has generally been that non Hispanic Whites would be more likely to be active online. Things are changing as we can see.

We also asked respondents to tell us about how many miles they would be willing to drive to make an ordinary purchase at a physical store. Below are the results.


As we can see Asians are least willing to drive/travel to make purchases in a physical store, while African Americans indicate they are willing to drive the longest distances. Hispanics and non Hispanic Whites are statistically intermediate in terms of the distances they are willing to drive. As shopping online becomes more prevalent, the convenience of not having to drive long distances to make a purchase is becoming prevalent among all cultural groups and more pronouncedly for Asians.

Are those less willing to drive more likely to find the tax advantage still available online more appealing?  I computed the correlations between the willingness to drive to make purchases and the data for the question “I purchase products online to save the money I would have to pay for State taxes.”  The correlation was -.032 or basically “zero,” meaning that lack of willingness to drive and the motivation to save State tax money are unrelated. People seem to make their purchases online because of convenience, regardless of cultural group. On a six point scale from zero to 5, respondents in this study gave an overall 3.62 to the statement “I shop online for the convenience of it” and there were no statistical differences among the cultural groups.

The moral of the story being told by these data is that online shopping takes an important part in our multicultural society and that marketers need to pay attention by vesting cultural attention in their emerging online clientele.

The data for this study was collected by Research Now of Dallas, Texas, thanks to the generous initiative of Ms. Melanie Courtright. Research Now contributed these data to the research efforts of the Center for Hispanic Marketing Communication at Florida State University. This online survey included the responses of 936 Asians, 458 African Americans, 833 Hispanics, and 456 non Hispanic Whites. This national sample had quotas for US region, age, and gender to increase representativeness.

Friday, July 13, 2012

Taxes, Convenience, and Multicultural Purchases Online

Many local merchants and multiple brick and mortar retailers complain that online merchants have an unfair advantage because many of them do not charge State and local taxes to purchasers. That is an interesting empirical question, particularly in the context of our multicultural society.

Are consumers more likely to buy online to save on taxes, or are they more attracted to online retailers because of convenience?  That is the key question guiding this study.

In the Spring of 2012, at the Center for Hispanic Marketing Communication of Florida State University, in collaboration with Research Now, we collected data for our yearly Multicultural Marketing Study.  We asked consumers to tell us how much they agree or disagree with the following statements:

- I purchase products online to save the money I would have to pay for State taxes
and
- If online merchants charged State tax I would continue purchasing online at the same rate I do now

Respondents could agree or disagree on a scale that went from completely disagree (0) to Completely agree (5).

Interestingly, across all respondents the average agreement with the first statement was 2.42 and 2.5 with the second statement, almost exactly in the middle of the scale. These overall trends appear to indicate that paying or not paying State taxes when shopping online is not a major consideration for shopping online. These findings tend to negate politicians’ and brick and mortar merchant arguments that advocate that local merchants would fare better if State taxes were imposed on online merchants.  

The breakdown by major ethnic groups reveals some interesting but mild differences.


Statistically, Asians agreed the most with “I purchase products online to save the money I would have to pay for State taxes.”  Hispanics were second and African Americans and Non-Hispanic Whites were least likely to agree with the statement. Still the differences are relatively small. Frugality may account for some of these differences.  Still, even the largest mean of 2.8 for Asians is still relatively small in the context of the scale and seems to indicate that saving on State taxes is not a major motivation for purchasing online.

The distribution of means for the second statement shows a contrasting pattern:


Even though the differences here are again relatively small, the tendency for non Hispanic Whites to agree more strongly with the statement “If online merchants charged State tax I would continue purchasing online at the same rate I do now” indicates cultural differences in the perception of value and saving on taxes. There was not statistically significant difference among Asians, Hispanics, and African Americans.

In sum, Asians seem to be somewhat more motivated by tax savings when purchasing online, and non Hispanic Whites appear to be more indifferent to online purchase taxation. Still, the main finding is clearly that overall, the impact of State taxing of online purchases is not likely to make a major difference.  Convenience appears to be a major motivation for making online purchases. The cost of fuel and the amount of time that it takes to shop in brick and mortar shops does not appear to compensate for State taxation.  It is unfortunate that brick and mortar businesses may not count on State taxation of line purchases to strengthen their businesses to any large extent. Perhaps the biggest lesson for marketers is that regardless of online taxation brick and mortar merchants need to transition to having a presence online.  Also, the results of this research do point to cultural differences in perceptions of online purchase taxation that can be of interest to marketers in their positioning of their offerings.

The data for this study was collected by Research Now of Dallas, Texas, thanks to the generous initiative of Ms. Melanie Courtright. Research Now contributed these data to the research efforts of the Center for Hispanic Marketing Communication at Florida State University. This online survey included the responses of 936 Asians, 458 African Americans, 833 Hispanics, and 456 non Hispanic Whites. This national sample had quotas for US region, age, and gender to increase representativeness.

Wednesday, May 23, 2012

Google Surveys are Here: Implications for Multicultural Research

Google is my favorite tech company these days. It has created and continues to create solutions that are quite outstanding.  That brings freedom of research and expression to the world, literally.

Recently the company launched Google Surveys. That allows users to:

  • Create a survey online, including graphics
  • Respondents answer questions to get free access to content online, one or two questions at the time, only
  • The content publishers get paid for allowing their viewers to answer questions
  • The survey creator finally gets the data tabulated and graphically displayed, and the data is updated continuously as more people answer

The system of Google Surveys is still being developed and eventually it will become a killer app, I think.  Right now the survey creator or researcher pays 10 cents per response, or 50 cents per response if the responses are from specific targets.  So, if you ask 50 questions from 500 Hispanics it costs you $2,500.  Not that bad although not that inexpensive either compared with companies like Research Now that can do similar work via River methodology at very competitive prices depending on the specifics of the project and include many more questions in one survey.  There are several issues that Google Surveys needs to address before their platform is really useful for multicultural research.  Here is why:


  • The fact that each respondent answers only one or two questions at a time makes correlations and multivariate statistics impossible to conduct.  If you have a survey with 50 questions, you need all 50 responses from each individual to be able to compute statistical associations and other relational analysis.
  • They are currently only targeting English language publishers, thus if the researcher wants to target “other language” respondents that is difficult as the incidence may be too low and the data slow to collect.
  • The cost is not really lower from that of competitors that do target “other language” groups, and who get individual respondents to actually complete an entire, let’s say, 50 question survey at one time. That way the researcher can conduct actual segmentations and other complex data analyses.
  • Also, the target of Google Surveys now are people who visit sites that charge for content. That makes the respondents somewhat idiosyncratic and perhaps not representative of the universe of online respondents.

At this time "Google Surveys" is a useful tool for people who want to know the answer to one or two very specific questions. In multicultural research, we usually need to find relationships between variables from the diverse cultural groups in the US.  Google Surveys does not seem to be ready to address these issues at this time. Nevertheless I am hopeful that they will eventually have a very general and powerful tool.