Pages

Showing posts with label asian. Show all posts

Thursday, May 1, 2014

Digital Media Use in the Multicultural Marketplace

At the end of 2013 at the Center for Hispanic Marketing Communication at Florida State University we conducted a survey of 735 Hispanics, 647 non-Hispanic Whites, 744 African Americans, and 732 Asians. The data was collected courtesy of Research Now, under the supervision of Ms. Melanie Courtright and Dr. Kartik Pashupati.


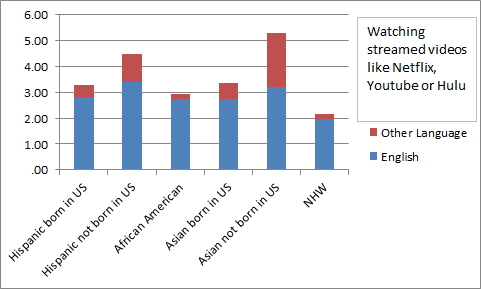
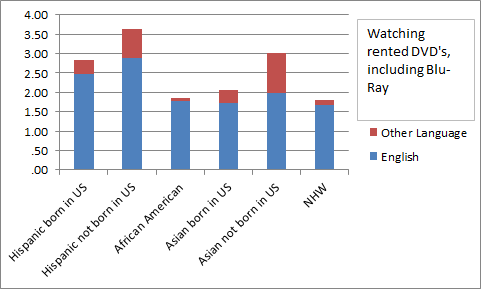
One of the segments of the online survey asked about the number of hours per week that respondents engage in different activities. Many of the items measured digital media usage. The data confirms many of the trends we have observed over the past few years and also provide some interesting surprises. As can be seen in the chart below, Hispanics and Asians watch the largest number of hours of streamed videos per week.
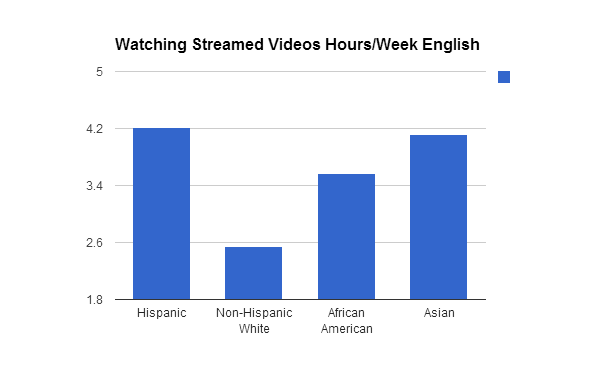
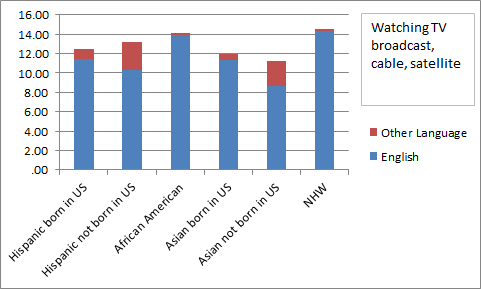
African Americans follow in order of weekly time spent and as found in prior research, non-Hispanic Whites use the least amount of video streaming. This picture should certainly send a message to providers of digital video streaming services. And note that this is the media used in English. The amount of time spent in another language is negligible for African Americans and non-Hispanic Whites, and relatively small for Hispanics (half an hour) and for Asians (slightly over one hour per week). The fact that most streaming is done in English may be related to the nature of the online panel, the availability of content, and the fact that English is becoming more prevalent among culturally diverse groups. Still, the key implication is that the new emerging majority is diverse, and is using English language video streaming. This is important because programmers of streaming media need to understand the cultural programming that is relevant to these consumers. The chart below illustrates the use of social media like Facebook. The findings are even more surprising.
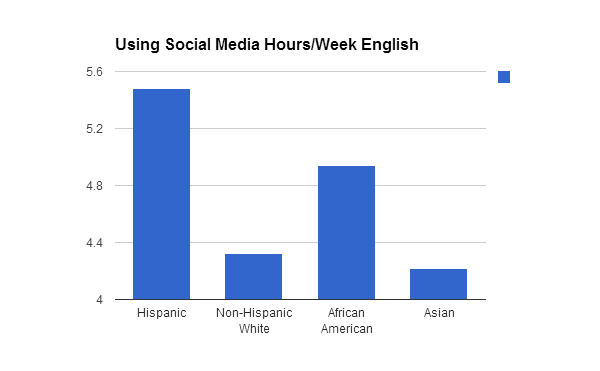
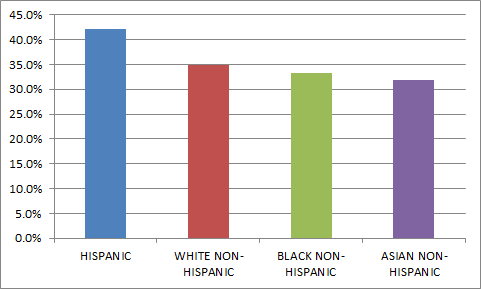
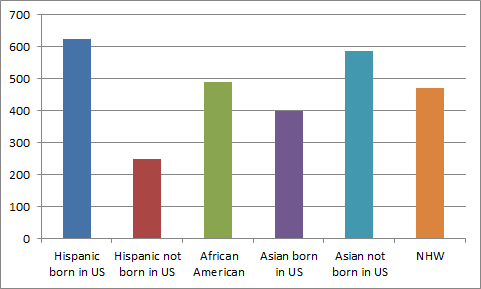
That Hispanics spend the largest amount of time with social media compared to anyone else is revealing. As learned in prior studies we found again that cultural minorities were more likely to use it.  In this study we found that Asians and non-Hispanic Whites are using social media less than their Hispanic and African American counterparts. The notion that these new technologies of liberation appeal the most to those who were previously deprived from such means of self-expression is interesting. Also, these findings show the relative sociability of the different cultural groups. The use of social media in another language for Asians and Hispanics is less than half an hour per week.


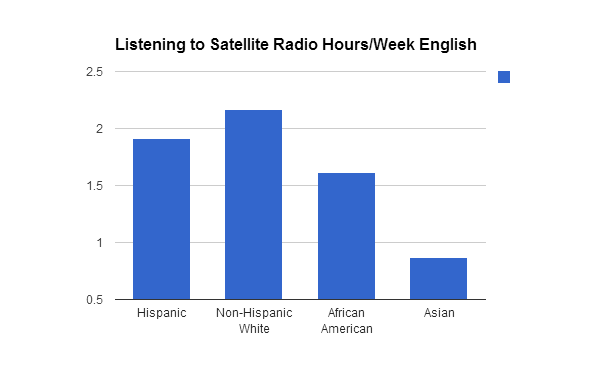
The picture of the amount of time spent listening to satellite radio is also revealing. Non-Hispanic Whites use this medium the most, followed by Hispanics and African Americans. Asians use it the least, as seen in the chart below.  These trends may be due to the costs associated with the medium and also to the availability of content relevant to these consumers.


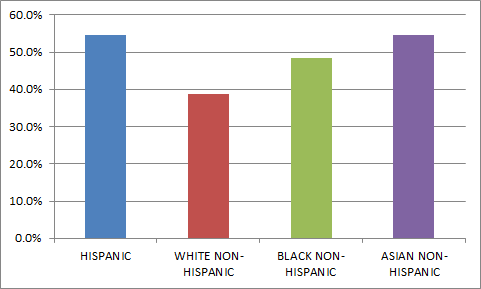
Listening to streamed audio on the Internet (like Pandora), presents a different pattern as seen below.
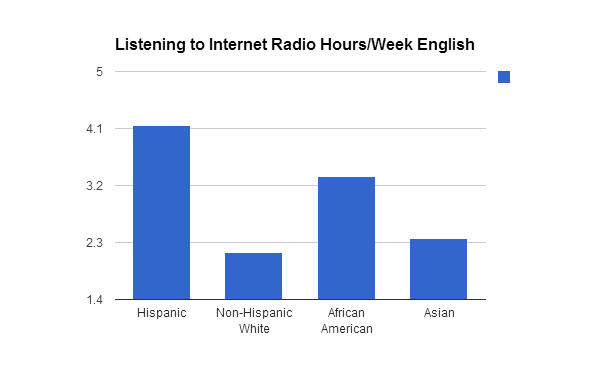
Hispanics are the most avid listeners of Internet radio, followed by African Americans, then Asians and finally non-Hispanic Whites.  The amount of exposure to Internet radio in another language is about an hour a week for Hispanics and about a quarter of an hour for Asians. As discussed in our book “Hispanic Marketing: Connecting with the New Latino Consumer” the cultural affinity of Hispanics to radio appears to strongly transfer to online offerings. And that seems to be also the case for African Americans.


For the purposes of a reality check we asked about the number of hours that these different cultural groups spend talking to friends in face-to-face situations. The most socially engaged are African Americans, they are followed by Hispanics and non-Hispanic Whites. Asians lag to some extent in English, but in general the levels of interpersonal face-to-face contact is high compared with social media, for example.
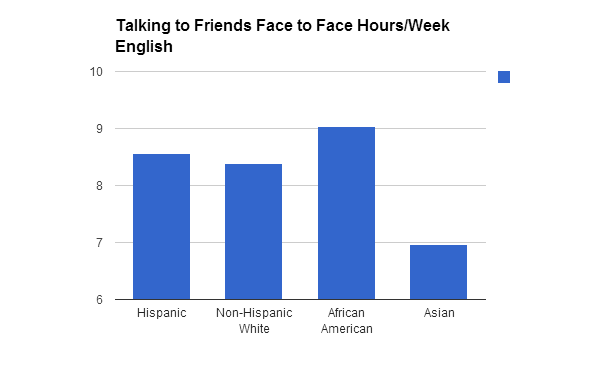
Thus the notion that social media is replacing interpersonal contact may not necessarily be correct.  The study of how social media and interpersonal face-to-face contact complement each other appears to be a priority. In this case, however, the use of another language does make a substantive difference as Hispanics spend almost two hours per week talking to friends face-to-face in another language (most likely Spanish, of course), And Asians spend almost an hour and a half per week in interpersonal communication with friends. When another language is included Hispanics are the most socially engaged, and Asians closely match non-Hispanic Whites. The use of one’s native language in personal communications seems to be more relevant than when using social media, and it makes sense. Still the largest amount of interpersonal contact is in English.  Again, we need to caution the reader that the composition of the sample may be responsible for the dominance of the English language, nevertheless the trends seem to be in line with current data and observations of increased English language usage among Hispanics and Asians. Clearly, this trend highlights the importance of understanding how culture and language use intersect and change the identity of culturally diverse individuals. The overall use of the Internet is documented in the chart below:
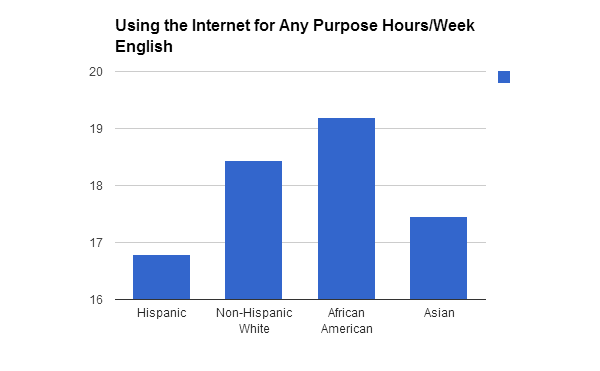
The overall use of the Internet is very high in general and when added to Hispanic and Asians the approximately one hour they spend in another language, they all seem to use it to very much to the same extent.


This data is robust in that it was collected with quotas for US region, age (18+) in different brackets, and gender. That it may be over-representing those who prefer English is possible.  Nevertheless, the numbers make sense in light that about 30% of US Hispanics prefer to communicate in Spanish, and the rest are a mix of English language preference or no preference.


The trends generally confirm that emerging minorities continue to lead in the use of digital media. While Netflix and Pandora, for example, are doing more in satisfying content preferences of culturally diverse audiences it seems like they could be doing more to the benefit of their own businesses and these audiences are their present and their future.  It is not just having Latin American, Asian, or African American movies and music that can bring increased revenue, but the understanding of non-obvious tastes and preference. A Netflix or Amazon series that reflects the values of Latinos, for example, without necessarily being just for Latinos could be more attractive than a mafia or government affairs theme.

Again, “all marketing is cultural.”

Tuesday, February 26, 2013

Children’s Influence in the Multicultural Marketplace

For many years I have conducted qualitative research with Latino women and have generally found that they are very willing to yield to their children’s requests for purchases, even if these are non-essential.  I have had the suspicion that this is particularly true of Hispanic women in comparison to other mothers but have not had the quantitative data to explore this idea.

Using data from Experian Marketing Services’ Simmons National Hispanic Consumer Study that was collected in the twelve months ending on August 31, 2012, I created crosstabulations with self identification as Hispanic/Latino, Asian, African American/Black, or White by those who agreed a lot or a little (combined) with the statement “I find it hard to resist my children’s requests for non-essential purchases” and “I enjoy shopping with my children.” The results for both have striking similarities, not surprisingly, perhaps, as seen in the charts below:

I Find it Hard to Resist My Children’s Requests for non-Essential Purchases


I Enjoy Shopping with My Children

Hispanics are quite a bit more likely to enjoy shopping with their kids and also to yield to their requests.  They are followed by Asians who show a similar pattern when it comes to enjoying the shopping experience with their kids, but not so in yielding to their requests for non-essential purchases.  Perhaps the Asian approach to child rearing, which is known to be stricter, accounts for their lack of yielding.  Non-Hispanic Whites and African Americans are less likely than Latinos to enjoy the shopping experience with kids and yielding to their children.

The meaning of these findings is likely to relate to the way in which these consumers interpret their relationship with their children.  In particular, I have heard Hispanics many times articulate the notion that they want their kids to have what they did not have as children.  They have also indicated they feel guilty for not doing the absolute best they can for their kids.

Hispanics are at a stage in their immigration and economic development where pleasing their children and families in general is a luxury they could not afford before. What they do in life is for their children and want them to be happy as they grow up.  They seem to place a very strong value in their sense of fulfillment. Perhaps Whites have become habituated to living in a culture of abundance where kids can wait to fulfill their desires and where shopping represents labor rather than fun.

This data shows that it is not just a stereotype but an actual trend that Latinos shop in family groups and have fun doing so.  Asians show a more complex pattern in which they enjoy the shopping experience with kids, but are strictest in pleasing kids as compared with anyone else.  The implications for marketers are that Latino children in particular can be important influences in the decision making regarding purchases of products and that they cannot be ignored in the overall communication and placement plan.

As we have discovered in other pieces of research, collective decision making is more prevalent among Latinos than among other groups. Thus, the different parts of the decision making process need to be taken into consideration.

The data used here is from Experian Marketing Services’ Simmons National Hispanic Consumer Study and was collected from August 1, 2011 to August 31, 2012. The sample of respondents with children at home contained 2,955 Latinos/Hispanics, 3,645 non-Hispanic Whites, 552 non-Hispanic African American/Black, and 253 non-Hispanic Asians.

Wednesday, January 30, 2013

How Should Brands Give Back in a Multicultural Market?

Marketers frequently ask how their brands can give back to a community to create good will and enhance their brand's position. The answer to the question is complex, but one of the ways of trying to address it is by asking consumers of different cultural and acculturation backgrounds how they rate different actions that brands can take in order to give back.

In 2012 with the cooperation of Research Now and the leadership of +Melanie Courtright, we again collected an online national sample composed of Hispanics and Asians born in the US and those born abroad, in addition to African Americans and Non-Hispanic Whites. We used the country of birth as a proxy for acculturation to see if technology adoption varied accordingly.

We asked respondents to rate different actions that companies can take to give back as follows:
“When a brand gives back to a community, which of the following are most and least important contributions from your perspective? Please rank in order, from 1, most important, to 5, least important, each of the following items.”

The following chart shows the total across all respondents (indicated by the blue bars) and for each of the culturally unique groups (indicated by the colored lines) for the rank of “Most Important” in regard to the following possible brand actions:

  • Provide jobs
  • Give scholarships
  • Help clean the environment
  • Keep jobs in the local community, and
  • Employees get free time to do community service


The rank shown is just the “Most Important” for each of the items. The totals for each culturally unique or acculturation group add to slightly more than 100% because each item was rated independently.

The first surprise is that the differences across culturally unique and acculturation groups is relatively small and that these cultural groups agree on the priority of the items.  The number one priority across the board is that the most important contribution that brands can make is to provide jobs to the community, followed by keeping jobs in the local community. It is perhaps not surprising that these two items have the highest priority given the economic downturn that most Americans have experienced in the recent past.

At a distance the next two priorities for brands are to help clean the environment and give scholarships. This does not necessarily mean that these are not important brand contributions, but that jobs are a more prevalent contribution at this time.

Interestingly, giving employees free time to do community service was ranked as top by the smallest proportion of respondents in each cultural group. This is perhaps due to the lack of visibility that such action may have as a contribution.

What are the lessons from these findings?

  1. Cultural groups and those at different levels of acculturation tend to agree on approaches that brands need to take to give back to the communities where they operate. Clearly, the implementation of providing jobs has to be by cultural group in order to satisfy the expressed sentiment of these consumers. Creating jobs is not enough but creating jobs that satisfy these segments individually.
  2. At times of economic distress there are actions that consumers feel are important but they subside to the more pressing issues of the time. While cleaning the environment and giving scholarships are important, jobs take preeminence in economic downturns.
  3. Marketers are encouraged to emphasize how their brands contribute to employment of these different cultural groups with specific emphasis on the local community.

The data for this study was collected by Research Now of Dallas, Texas, thanks to the generous initiative of +Melanie Courtright. Research Now contributed these data to the research efforts of the Center for Hispanic Marketing Communication at Florida State University (+Hispanic FSU). This online survey included the responses of 936 Asians (398 US born), 458 African Americans, 833 Hispanics (624 US born), and 456 non Hispanic Whites. This national sample had quotas for US region, age, and gender to increase representativeness.

Wednesday, November 14, 2012

Multicultural Technology Leadership: Tablets and Blogs

Over the past several years we have measured technology use and adoption at the Center for Hispanic Marketing Communication at Florida State University. We have consistently found that emerging minorities tend to lead in most areas of technology adoption. In 2012 with the cooperation of Research Now and the leadership of Ms. Melanie Courtright, we again collected an online national sample composed of Hispanics and Asians born in the US and those born abroad, in addition to African Americans and Non-Hispanic Whites. We used the country of birth as a proxy for acculturation to see if technology adoption varied accordingly.

Tablets are creating chaos in the computer industry because consumers are adopting them and discarding laptops, desktops, and netbooks. The following chart shows how adoption of tablets varies of by cultural group and by place of birth.


As can be seen, Asians born abroad exhibit the largest penetration of tablet current ownership and also their projected ownership in the next year. Their affluence and technological savvy may account for this trend. Hispanics not born in the US are the second group in their ownership of tablets, and their minority counterparts follow them closely. Non-Hispanic Whites, however, lag substantially. This speaks of the technology eagerness of minorities and their leadership in technology adoption.  The differences, however, appear to vanish when looking at aspirations for the next year. Thus, minorities innovate but tablets are becoming very desirable overall.

Having a blog should be a good indicator of innovativeness in web communications. The following chart illustrates the penetration of blog ownership in different cultural groups.


Current blog ownership is highest among Asians, followed by Hispanics. African Americans and Non-Hispanic Whites lag. Tendencies for the next year vary and highlight that those not born in the US are more interested in having a blog, both Latinos and Asians. African Americans also show the aspiration to have a blog in a year in sharp contrast to their current blog ownership. Non-Hispanic Whites seem less eager to have a blog now and in the future, and interestingly Asians born in the US are at the same level as Non-Hispanic Whites in their future blog ownership.

Overall, these trends are puzzling and definitely should ignite the imagination of technology marketers. The relative popularity of blogs and their future growth indicate the social eagerness of minority groups. Culturally, blogs provide an outlet for creativity, expression, and a voice that minorities did not have before.  Marketers can take advantage of this eagerness by using these growing blogs as advertising venues for reaching out to minority networks, for example.

The phenomenal adoption of tablets and their appeal for the near future are more striking.  Mobile advertising will become increasingly powerful and tablets will be the new platform for communication. That minorities are leading now should give food for thought to marketers that are trying to predict future trends and understand where their brands will be in the near future.

The data for this study was collected by Research Now of Dallas, Texas, thanks to the generous initiative of Ms. Melanie Courtright. Research Now contributed these data to the research efforts of the Center for Hispanic Marketing Communication at Florida State University. This online survey included the responses of 936 Asians (398 US born), 458 African Americans, 833 Hispanics (624 US born), and 456 non Hispanic Whites. This national sample had quotas for US region, age, and gender to increase representativeness.

Thursday, August 23, 2012

Multicultural Video Consumption by Mode of Delivery


How is the amount of time spent watching video divided among streaming, DVD’s, and broadcast/satellite/cable among the different cultural groups in the US?  Here we present some of the data collected by Research Now for the Florida State University Multicultural Marketing study of 2012 that answers that question.

We asked our online sample of respondents to tell us “in an average week, approximately how many hours do you spend...?” for multiple activities. The respondents were divided into those born in the US and those born abroad because that could have an impact on the language they select for their video exposure.

Below is the chart detailing the number of weekly hours spent watching streamed videos by different cultural groups. As can be seen streaming is most popular among Hispanics and Asians not born in the US and least among non-Hispanic Whites. Asians not born in the US report more than five hours per week watching these videos, followed by Latinos not born in the US with almost five hours per week. It may be that these groups, because of their bilingualism add more content to their routines.


As seen in the chart below, watching rented DVD’s presents a similar pattern, but the number of hours allocated to this video delivery mode is lower and Hispanics born abroad have the highest tendency to rent DVD’s. In general, Hispanics and Asians are generally more likely to rent DVD’s than anyone else.  Perhaps the heritage of countries of origin and the availability of certain types of content account for these differences.

Watching TV via broadcast, cable, and satellite is still the dominant mode of video consumption as can be seen below.  

It is interesting to note, however, that those more likely to stream and rent are those less likely to watch TV in more traditional ways.  Asians and Hispanics are less likely to watch broadcast than their African American and non-Hispanic White counterparts.

These results imply that changes in video watching routines vary by cultural group and by place of birth, with the obvious implication for language preferences. Video providers like Netflix and Hulu that favor streaming are likely to be more attractive to Hispanics and Asians, particularly those born abroad. Traditional video providers like Comcast, Dish Network, and broadcast may do well in anticipating the transition that is taking place by putting more of their content online, in particular if they wish to survive in a much more competitive environment. In this new environment emerging culturally diverse groups appear to be taking the lead in enjoying newer modes of delivery.  

Cable and satellite companies may not only want to make their content available online but also they may want to reconsider how subscribers buy their content. The greater ability to choose provided by streaming and the fading DVD’s mode is not as available in cable and satellite since these companies require the purchases of large bundles of programming.

All in all, the competitive world of online video delivery seems to be hot and worthy of much attention.

The data for this study was collected by Research Now of Dallas, Texas, thanks to the generous initiative of Ms. Melanie Courtright. Research Now contributed these data to the research efforts of the Center for Hispanic Marketing Communication at Florida State University. The distribution of the sample is as follows:
This national online sample had quotas for US region, age, and gender to increase representativeness.

Friday, July 27, 2012

Online Expenditures in the Multicultural Marketplace

How much money do members of different cultural groups spend online in an average month? What percentage of their purchases does that represent? These are two of the questions addressed with culturally diverse consumers in the 2012 multicultural marketing study of the Center for Hispanic Marketing Communication of Florida State University in cooperation with Research Now.

Monthly expenditures online differ in a somewhat predictable and interesting way as can be seen in the chart below.


Asians in the US indicate they spend about $125 dollars making purchases online and this mean is statistically different from that of all other groups. There was not a statistically significant difference among Non Hispanic Whites, African Americans and Hispanics. The affluence of US Asians and their proclivity for online shopping may account for this difference. Still the amount of money of the three other cultural groups is substantive as well.

Interestingly, the proportion of purchases reported did not differ statistically among most groups as seen in the chart below, except that non Hispanic Whites reported a somewhat lower proportion of monthly online purchases than the other three groups..


The overall trends are notable because many marketers have not realized that once online consumers of all groups tend to spend about the same amount on online purchases. Thus, online marketing should be directed to each of these groups emphasizing the unique cultural relevance of the product or service.  Basically, once online there does not seem to be a dominant group to whom messages need to be directed.  In the average, all these consumers are spending similar amounts. Notably, Asians tend to stand out as online shoppers because of their affluence, and non Hispanic Whites by being somewhat less eager to purchase online. This latter finding is counterintuitive because the expectation has generally been that non Hispanic Whites would be more likely to be active online. Things are changing as we can see.

We also asked respondents to tell us about how many miles they would be willing to drive to make an ordinary purchase at a physical store. Below are the results.


As we can see Asians are least willing to drive/travel to make purchases in a physical store, while African Americans indicate they are willing to drive the longest distances. Hispanics and non Hispanic Whites are statistically intermediate in terms of the distances they are willing to drive. As shopping online becomes more prevalent, the convenience of not having to drive long distances to make a purchase is becoming prevalent among all cultural groups and more pronouncedly for Asians.

Are those less willing to drive more likely to find the tax advantage still available online more appealing?  I computed the correlations between the willingness to drive to make purchases and the data for the question “I purchase products online to save the money I would have to pay for State taxes.”  The correlation was -.032 or basically “zero,” meaning that lack of willingness to drive and the motivation to save State tax money are unrelated. People seem to make their purchases online because of convenience, regardless of cultural group. On a six point scale from zero to 5, respondents in this study gave an overall 3.62 to the statement “I shop online for the convenience of it” and there were no statistical differences among the cultural groups.

The moral of the story being told by these data is that online shopping takes an important part in our multicultural society and that marketers need to pay attention by vesting cultural attention in their emerging online clientele.

The data for this study was collected by Research Now of Dallas, Texas, thanks to the generous initiative of Ms. Melanie Courtright. Research Now contributed these data to the research efforts of the Center for Hispanic Marketing Communication at Florida State University. This online survey included the responses of 936 Asians, 458 African Americans, 833 Hispanics, and 456 non Hispanic Whites. This national sample had quotas for US region, age, and gender to increase representativeness.

Wednesday, May 23, 2012

Google Surveys are Here: Implications for Multicultural Research

Google is my favorite tech company these days. It has created and continues to create solutions that are quite outstanding.  That brings freedom of research and expression to the world, literally.

Recently the company launched Google Surveys. That allows users to:

  • Create a survey online, including graphics
  • Respondents answer questions to get free access to content online, one or two questions at the time, only
  • The content publishers get paid for allowing their viewers to answer questions
  • The survey creator finally gets the data tabulated and graphically displayed, and the data is updated continuously as more people answer

The system of Google Surveys is still being developed and eventually it will become a killer app, I think.  Right now the survey creator or researcher pays 10 cents per response, or 50 cents per response if the responses are from specific targets.  So, if you ask 50 questions from 500 Hispanics it costs you $2,500.  Not that bad although not that inexpensive either compared with companies like Research Now that can do similar work via River methodology at very competitive prices depending on the specifics of the project and include many more questions in one survey.  There are several issues that Google Surveys needs to address before their platform is really useful for multicultural research.  Here is why:


  • The fact that each respondent answers only one or two questions at a time makes correlations and multivariate statistics impossible to conduct.  If you have a survey with 50 questions, you need all 50 responses from each individual to be able to compute statistical associations and other relational analysis.
  • They are currently only targeting English language publishers, thus if the researcher wants to target “other language” respondents that is difficult as the incidence may be too low and the data slow to collect.
  • The cost is not really lower from that of competitors that do target “other language” groups, and who get individual respondents to actually complete an entire, let’s say, 50 question survey at one time. That way the researcher can conduct actual segmentations and other complex data analyses.
  • Also, the target of Google Surveys now are people who visit sites that charge for content. That makes the respondents somewhat idiosyncratic and perhaps not representative of the universe of online respondents.

At this time "Google Surveys" is a useful tool for people who want to know the answer to one or two very specific questions. In multicultural research, we usually need to find relationships between variables from the diverse cultural groups in the US.  Google Surveys does not seem to be ready to address these issues at this time. Nevertheless I am hopeful that they will eventually have a very general and powerful tool.

Thursday, April 5, 2012

Communication Behaviors in the Multicultural Marketplace


In 2011 with our national online data set we summed the number of hours per week that different cultural groups spend on different communication activities in English and in another language. These included:

     Listening to CD’s
     Listening to the radio
     Listening to MP’3’s on any device including an iPod or mobile phone
     Listening to music on television
     Using social media like Facebook or Twitter
     Listening to Internet radio like Pandora or Last.fm
     Talking with friends

While these are not all the communication activities a person can engage in, the list should be a good indicator of overall communication activities by different cultural groups. The graph below reports the total number of hours per week reported in the average by each of the cultural groups in English and in another language. Clearly, the other language used would be almost universally Spanish in the case of Hispanics.

Average Sum of Diverse Communication Behaviors

The results are quite striking. Hispanics in general spend more time per week in the communication activities measured, and those Latinos who answered in Spanish (HS) reported spending more than 60 hours in media and communication per week, almost double the amount of time than non-Hispanic Whites (NHW). What is particularly salient is that the amount of time Latinos who prefer Spanish engage in English language communication is almost the same as non-Hispanic Whites. These Latinos are on “double communication duty.”

It is also important to emphasize that while Hispanics who prefer Spanish spend at least half of their time with English media and communication activities, they still spend the other half with English language communications. So it is not one language that is dominant for these online consumers, they split their communication world in two.

Hispanics who prefer English (HE) spend about 25% of their time with Spanish language media and communication, and they are the second most communicative group of all, with more than 50 hours per week. The third most communicative group is that of African Americans (AA) with about 43 hours per week, followed by Asians (A) with about 38 hours per week. Non-Hispanic Whites reported the least amount of time per week engaged in communication activities. A next posting will break down each of the activities. Here, however, the striking overall differences in amounts deserve some discussion.

The sheer amount of time spent on communication by Latinos in general should be of interest to marketers as these consumers should be especially available to receive commercial messages. We have known for some time that Hispanics are more welcoming of marketing messages, but this analysis substantiates the amazing communication openness of Hispanic consumers.

Further, marketers that produce entertainment content should find here substantiation of the enormous potential of this Latino audience. Social media use and personal interactions not only serve for the reinforcement of social ties but they also spread the word about marketing efforts.

In this case as in others we have reported earlier, we find that Hispanics and minorities in general tend to be more communicative than their non-Hispanic White counterparts. This should give some food for thought to marketers who think that their future still resides in the so called “general market.”

The data for this study was collected during March 2011. This online sample was comprised of 500 respondents per segment, for a total of 2,500, based on quotas by gender, age, and geographic location. DMS Insights managed the sample and data collection and they graciously contributed their effort to the academic program of the Center for Hispanic Marketing Communication at Florida State University. Melanie Courtright, previously with DMS Insights championed this effort. She is now with Research Now and continues to support our research. This study was conducted by the faculty and students of the graduate Multicultural Marketing Communication course offered by FSU.

Monday, February 6, 2012

Multicultural Marketing and the Super Bowl 2012

Marketers seem to be missing the ball. Madison Avenue and its chronic lack of cultural awareness and representation are evident in the 2012 Super Bowl ads. Blacks and Hispanics can only be seen in the background and as factory or service workers of some type. An online car seller shows a Black buyer a a main character, and a car ad shows a couple of Inuits as main characters, other than that it looks like non-Hispanic Whites own the show along with multiple dogs and polar bears.

Listen, I love non-Hispanic Whites, dogs, polar bears, and most other interesting and cute characters.  That is not the issue.  The issue is that minorities are about 40% of the total population in the US and they are almost invisible and stereotyped in the most prominent ad event in the United States. And I am not asking for fair representation. That is not the issue either.  I am advocating for business sense. How can emerging minorities identify with brands if they are not seen associated with them? And, how can they be compelled if the cultural values of these minorities are not represented?

As I was enjoying the Super Bowl ads it came to mind how our industry is still incredibly naive about what is driving the economy and innovation in this great Country. Emerging minorities are driving technology adoption and have larger families. I am mystified as to how can advertising firms miss the changing cultural environment of the US.  I thought I would share my surprise.

Saturday, January 7, 2012

Multicultural Consumer Spending on Entertainment


With our national online data collected in 2011, students in the graduate Multicultural Marketing Communication course and I measured some key indicators of entertainment spending in the multicultural marketplace. We have known that Hispanics and other emerging minorities tend to watch more movies in theaters and also rent more to watch at home than non-Hispanic Whites[1] . We have not known much about overall entertainment spending, videogame and music spending, however. Below I explore some of the trends available as reflected in our data.

Overall spending on entertainment on a typical month is lead by Hispanics who prefer to communicate in Spanish followed by Asians and by Hispanics who prefer English.  African Americans and non-Hispanic Whites, while also spending substantially on entertainment, are less likely to spend $50 or more per month. The following graph shows the percentage of people in each cultural group that indicate spending $50 or more on entertainment in a typical month.


These tendencies tell marketers some of the story of where entertainment spending is likely to come from in the future. Looking at average expenditures instead of percentages of people spending more than $50 changes the picture a bit as seen in the following chart.


Here the reader can see that in the average Hispanics in general spend between $10 and $20 dollars more on entertainment in a typical month. This chart also highlights how sensitive the data is to different representations since in the average African Americans are closer to Hispanics in their spending than when looking at percentages of individuals. Still the consistent trend is that there are cultural groups leading with their wallets and they need to be taken seriously in future planning.

We also looked at expenditures in music purchases, and here the trend is for Latinos to lead even more dramatically as seen in the chart below:


To further substantiate these trends we asked consumers to tell us about the number of concerts they attend during a year:


Concert going follows a similar pattern to that of entertainment in general.  Given the popularity of video games these days we also asked about video game expenditures:


Not surprisingly emerging minorities overindex in comparison with non-Hispanic Whites in regards to video game expenditures in the average. This may not be too surprising because of the inherent youth of emerging minorities in the US.

The data we have collected since 2006, every year, has shown similar patterns. The consistency is quite impressive and it is hard to dismiss. Despite economic adversity Latinos, and in some cases, others continue to spend on what is important to them. Music, events, and the enjoyment of everyday life is precisely part of what is important to survive in the good and the bad times. There are cultural tendencies that marketers need to better understand. It is not just the superficial apparent differences among ethnic groups but the deep beliefs they hold dear and on which they are willing to spend their hard earned money. I suggest that marketing executives should take a serious look at where their budget priorities are in order to enhance the bottom line of their companies. That is by prioritizing their merchandizing and communications to address the preferences of those who lead in the multicultural marketplace.

The data for this study was collected during March 2011. The online sample was comprised of 500 respondents per segment, for a total of 2,500, based on quotas by gender, age, and geographic location. DMS Insights, a uSamp Company, managed and graciously contributed the sample and data collection. This study was conducted by the faculty and students of the graduate Multicultural Marketing Communication course offered by FSU.


[1] See “Hispanic Marketing: Connecting with the New Latino Consumer” by Felipe and Betty Ann Korzenny, published by Routledge, 2011, page 314.